Showing posts with label gcp. Show all posts

Wednesday, June 24, 2020

Serverless Monitoring: What do we Monitor when the Server Goes Away?

Originally written for The SLAppForge Blog; Feb 17, 2020

Monitoring your serverless application is crucial - especially while it is handling your production load. This brings us to today's topic, how to effectively monitor a serverless application.

Serverless = Ephemeral

Serverless environments are inherently ephemeral; once the execution completes, you don't have much left behind to investigate.

There's so much exciting talk about container reuse and keep-warm, but theoretically every single one of your function could be a cold-start. Even with reuse, you don't get access to the environment to analyze the previous invocation, until the next one comes in.

So, to effectively monitor a serverless system, we have to gather as much data as possible - while it is actually handling a request.

Monitoring the Ephemeral. The Dynamic. The Inaccessible.

Serverless offers the benefit of less management, through higher levels of abstraction; for obvious reasons, that comes hand in hand with the caveat of less visibility.

In short, you pretty much have to either:

  • depend on what the serverless platform provider discloses to you, or
  • write your own monitoring utilities (telemetry agents, instrumentations etc.) to squeeze out more metrics from the runtime

Log Analysis

Logs are the most common means of monitoring, auditing and troubleshooting traditional applications; not surprisingly, it holds true in serverless as well.

What's in a Log?

All major serverless platforms offer comprehensive logging for their FaaS elements: CloudWatch Logs for AWS Lambda, StackDriver Logging for Google Cloud Functions, Azure Monitor Logs for Azure Functions, CloudMonitor for Alibaba Cloud Functions, and so forth.

The logs usually contain:

  • execution start marker, with a unique ID for each request/invocation
  • all application logs generated during execution, up until the point of completion of the invocation
  • execution summary: duration, resources used, billed quota etc.

Serverless is not just FaaS; and logging is not just about function executions. Other services like storage, data-storage and networking also provide their share of logging. While these are mostly associated with access and security auditing (e.g. CloudTrail auditing), they can still be merged with FaaS logs to enable more verbose, detailed monitoring.

Distributed Logging: A Nightmare?

One problem with the inherently distributed nature of serverless systems, is that these logs are usually scattered all over the place; unlike in a traditional monolith where all logs would be neatly arranged in one or a few well-known files.

Imagine your backend consists of five Lambdas, which the web client invokes in a particular sequence to get a job done - or are coordinated through Step Functions or Destinations; the logs for a single "call" could span five log streams in five log groups.

It may sound simple enough during development; but when your production app goes viral and starts receiving hundreds of concurrent calls, tracking a single client journey through the logs could become harder than finding a needle in a haystack.

Log Aggregation

This is where log aggregation services come into play. (In fact, serverless was lucky - because log management had already received a boost, thanks to microservice architecture.) Services like Coralogix and Dashbird will ingest your logs (via push or pull) and allow you to perform filters, aggregations, summarizations etc. as if they were from one or a few sources.

With visibility to long-term data, aggregation services can - and do - actually provide more intelligent outputs; such as real-time alerts on predefined error levels/codes, and stability- or security-oriented anomaly detection through pattern recognition, machine learning etc.

Resource Usage

Even with your application logic running like clockwork, the system could start failing if it is under-provisioned and runs out of resources; or become a budget-killer if over-provisioned.

Additionally, unusual patterns in resource usage may also indicate anomalies in your applications - such as attacks, misuse and other exploits.

What can we Measure?

  • memory usage
  • execution time or latency: given that FaaS invocations are under strict timeout constraints, time becomes a critical resource. You do not want your function to time-out before completing its job; but you also do not want it to remain hung indefinitely over a bad database connection that is going to take two minutes to time-out on its own.
  • compute power used: in many platforms, allocated compute power grows in proportion to memory, so the product of allocated memory and execution time is a good relative measure for the total compute power consumed by the request. In fact, most platforms actually bill you by GB-seconds where GB refers to memory allocation.

Resource Isolation

Serverless invocations are isolated, which means one failure cannot affect another request. Sadly, it also means that each runtime instance should be able to handle the largest possible input/request on its own, as there is virtually no resource sharing across instances; one request handler cannot "borrow" memory from another, as is the case in monolithic apps with multiple services on the same runtime/VM.

This is bad in a sense, that it denies you of the luxury to maintain shared resources (e.g. connection pools, memory-mapped file caches, etc.) to be pooled across requests. But at the same time, it means that managing and monitoring per-request resources becomes easier; each time you allocate or measure it, you are doing it for a single request.

From Logs

As mentioned before, serverless logs usually contain execution summaries stating the allocated vs. maximum memory usages, and exact vs. billed execution time.

From Runtime Itself

Your application runs as a Linux process, so it is always possible to grab resource usage data from the runtime itself - either via standard language/runtime calls (e.g. NodeJS process.memoryUsage()) or by directly introspecting OS-level semantics (e.g. /proc/self/stat). Some aspects like execution time are also provided by the serverless runtime layer - such as remaining time via context.getRemainingTimeInMillis() on Lambda.

From Serverless Platform Metrics

Most platforms keep track of resource metrics themselves. AWS CloudWatch Metrics is perhaps the best example.

While CloudWatch does not yet offer memory or compute graphs, third party tooling like SigmaDash can compute them on your behalf.

Platforms usually provide better metrics for non-FaaS systems than they do for FaaS; probably because of the same challenges they face in accurately monitoring the highly dynamic environment. But they are constantly upgrading their techniques, so we can always hope for better.

For non-compute services like storage (e.g. AWS S3), persistence (e.g. AWS DynamoDB) and API hosting (e.g. AWS API Gateway), platforms offer detailed metrics. The upside with these built-in metrics is that they offer different granularity levels, and basic filtering and summarization, out of the box. The downside, often, is that they are fairly non-real-time (generally several seconds behind on the actual request).

Also, for obvious reasons, longer analysis periods mean lesser granularity. Although you can request for higher-precision data, or report custom metrics at desired precisions, it will cost you more - and, at serverless scales, such costs can add up fairly quickly.

Invocations, Errors and Throttles

While logs and resource usages can reveal anomalies during execution, these depict more straightforward serverless monitoring metrics related to the actual end results of application invocations. In that sense, resource monitoring can be treated as oriented more towards performance, whereas error/throttle monitoring leans more towards correctness, stability and scalability.

You can usually grab these numbers from the built-in metrics of the platform itself.

Invocations-to-error Ratio

Similar to signal-to-noise ratio (SNR), this is a measure of how "efficient" or "robust" your application is; the higher it is, the more requests your application can successfully serve without running into an error.

Of course, the validity of this serverless monitoring metric depends on the actual nature and intent of your code, as well as the nature of inputs; if you receive lots of erratic or failure-prone inputs, and you are actually supposed to fail the invocation in such cases, this value would be naturally high.

Throttles

Presence of throttles could indicate one of a few things:

  • You have (perhaps mistakenly) throttled your function (or the API/interface) below its regular concurrency limit.
  • Your application is under a denial-of-service (DoS) attack.
  • Your application's scalability goes beyond what the serverless platform can occur (maybe it has gone viral); you need to re-architect it to batch-up invocations, introduce back-offs to safely deal with rejections, etc.

Note that throttling issues are not always limited to front-facing elements; if you are asynchronously triggering a function from an internal data stream (e.g. a Lambda with a Kinesis trigger) you could run into throttling, based on the dynamics of the rest of the application.

Also, throttling is not always in front of FaaS. If a third-party API that your application invokes (e.g. Amazon's own seller APIs) gets throttled, you could run into issues even without an apparent increase in the fronting traffic, events or invocation counts. Worse, it could lead to chain reactions or cascading failures - where throttling of one service can flow down the execution path to others, and eventually to the user-facing components.

Once you are on the upper ends of scalability, only a good combination of API knowledge, fail-safe measures and serverless monitoring techniques - logs, throttles and runtime latency measurements - can save you from such scenarios.

Instrumenting

So far, all serverless monitoring techniques we discussed, have been dependent on what the runtime and platform offer by default, or out-of-shelf. However, people find these inadequate for monitoring serious production applications where:

  • service health and performance are critical,
  • early detection of anomalies and threats is vital, and
  • alerts and recovery actions need to be as fine-grained and real-time as possible.

To get beyond what the platform offers, you usually need to instrument your runtime and grab additional serverless monitoring insights. This can be via:

For FaaS, this obviously comes with implications on performance - your function runtime now has to spare some cycles to gather and report the metrics; in many cases, the tools also require you to modify your application code. Often these changes are subtle enough - such as importing a library, calling a third-party method, etc.; nevertheless, it goes against the developers' and dev-ops' pipe dream of code-free monitoring.

Realizing the demand for advanced serverless monitoring and diagnostics, cloud platforms themselves have also come forth with instrumentation options:

  • AWS X-Ray ships with Lambda by default, and can be enabled via a simple configuration with no code change. Once enabled, it can report the latencies of different invocation phases: initialization, individual AWS API/SDK calls, etc. With a bit of custom code it can also capture calls to any downstream HTTP service - which can come in handy when monitoring and troubleshooting latency issues.
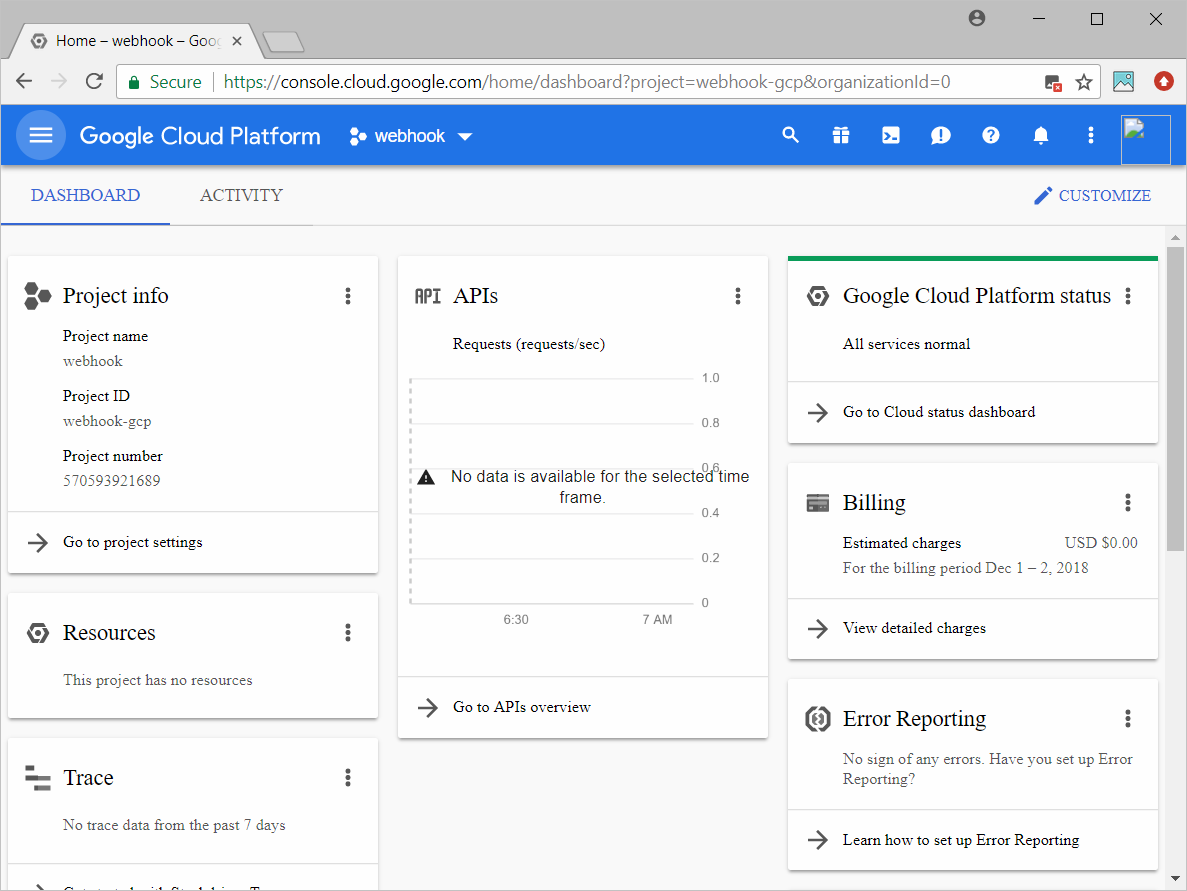
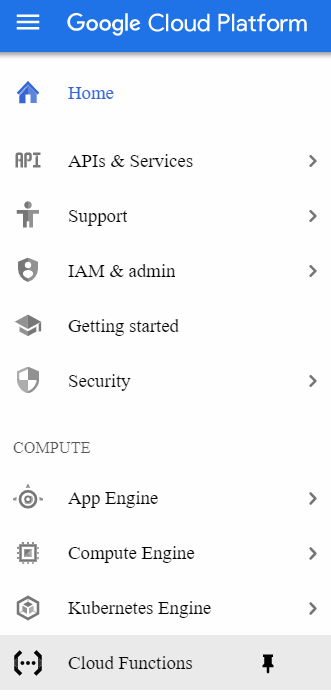
  • Google Cloud Functions offers StackDriver Monitoring for advanced analytics via built-in timing, invocation and memory metrics; as well as custom metrics reporting and alerting.
  • Azure Functions has its own Azure Application Insights service offering performance analytics .

However, the best work related to instrumentation have come from third-party providers, such as the ones mentioned earlier. These usually require you to subscribe to their services, configure your serverless platforms to report metrics to theirs, and provide analysis results and insights intelligence through their own dashboards.

Serverless Monitoring, up against Privacy and Security Concerns

The obvious problem with delegating serverless monitoring responsibilities to third parties, is that you need to guarantee the safety of the data you are sharing; after all, it is your customers' data.

Even if you implicitly trust the third party, you need to take precautions to minimize the damage in case the monitoring data gets leaked - for the sake of your users as well as the security and integrity of your application.

  • Anonymizing and screening your logs for sensitive content,
  • using secure channels for metrics sharing, and
  • always sticking to the principle of least privilege during gathering, sharing and analysis of data

will get you started on a robust yet safe path to efficiently monitoring your serverless application.

Friday, February 28, 2020

Set Up Your Free Serverless Webhook - in Minutes!

Get started on your serverless journey. Right here. Right now.

Note: This article is several months obsolete; after all, these days, who would want to deploy a serverless webhook from Google Cloud dashboard, when you can do the same with just a few clicks - on the world's best serverless IDE?!


Often you need to set up a HTTP/S endpoint (webhook) for accepting data posted from another application or service; such as GitHub webhooks. Here is a quick way to set one up one, without having to run, pay for, or maintain a server of your own. (And hence the term "serverless webhook".)

We'll stick to Google Cloud Platform; it's quick to register if you already have a Google account (which I guess you do ;)), and is totally free. You do have to provide a credit/debit card (all cloud platforms do); but unless your endpoint receives a huge traffic, you would be completely covered by the free tier. Plus, you receive $300 free credits to try out any of the other cool Google Cloud Platform services.

Let's assume you want a webhook that accepts POST requests on the path /webhook.

We need two main things:

  • a HTTP endpoint that accepts the data, and
  • a compute entity (Google Cloud Function) to consume and process the data

Create a new Cloud Plaform Project

If you haven't already done so,

  • Click on the project name drop-down on the header, and then New Project.

create new project

  • Provide a name for your project (or let Google auto-generate one for you).

naming your project

  • Click Create. Google will start creating your project; it could take a few seconds. You can check the status via the notification drop-down (bell icon) on the page header.

Cloud Console notifications drop-down

  • When the project is ready, you will be taken to the project dashboard.

project created; we're on the dashboard

Sign up for Google Cloud Functions

Cloud Functions menu item

  • Since you are probably new to Cloud Functions, the dashboard will first ask you to enable the Cloud Functions API. (If not, you can skip the next few steps.)

Cloud Functions: sign-up page; 'Cloud Functions API not enabled'

If you already have a billing account configured, you can simply select it and proceed. Otherwise, add your card details here and proceed. (Repeat: this is mostly a formality, and your project would be totally free.)

filling in your card details

  • Once your card is confirmed, you'll end up back on the Cloud Functions dashboard.

Create a new function

  • Click Create Function. The Create Function page will open up.

Cloud Functions enabled; now you can create a function

  • Provide a name for your function; this will also be the pathname of the webhook URL, so I will choose webhook. You also need to select a runtime. I chose NodeJS 6.
  • Pick HTTP as the Trigger Type.

function configuration

Write the code

  • Click Next. You'll be taken to a page where you can edit the function code.

function code editor

  • Now you can write the custom logic for handling the webhook request. The request will be available via the req parameter as an Express.js Request object.

After handling, you can respond via the res parameter which is an Express.js Response object:

res.send("success!");

If you want to use external (NPM) dependencies, switch to the package.json tab and define them under a dependencies entry, as usual.

Deploy it

  • When done, click Create. You'll be taken back to the dashboard.

back in the dashboard; function is being created

You'll see your function listed in the previously-empty list, with a spinner in front. Wait till it changes to a green check mark - indicating that the function is live.

Once the function is live, your webhook is ready!


Test it

To test what you just built,

  • Open a HTTP client (e.g. Postman), and set the URL to https://<region>.<project-name>.cloudfunctions.net/<function-name> (e.g. https://us-east-1.myscellanius.cloudfunctions.net/webhook). You can also find the URL through the Trigger tab:

    function details: 'Triggers' tab

  • Set the request method to POST, if not already.
  • Paste the payload you want to send, and send the request.
  • You should receive the response generated by your cloud function.

You can also use the built-in testing feature of the Cloud Functions dashboard to directly invoke your function with a suitable payload:

testing your function from the Cloud Functions dashboard

Checking the logs

If you receive an error, or would like to see any logs generated by the function, you can use the View Logs command on the ellipsis drop-down of the dashboard entry to visit the full-blown StackDriver logging dashboard.

For test invocations, the logs are displayed right below the Output pane:

logs for the function


What's next?

This was quick and easy; but it could become a headache to switch between dashboards and manually upload code bundles whenever there's a change to your handler logic.

Using a proper deployment tool would save you time, and also allow you to keep your cloud resources grouped together. For example, you may need to incorporate a Cloud Storage bucket or a Pub/Sub topic into your logic; in that case it would be quite easy to deploy them automatically as one unit, instead of manually doing each via the different dashboards.

And in case you didn't know, that tool is already here: create function, write code, add dependencies; and save, build and deploy with one button click!

Friday, November 29, 2019

Google Cloud has the fastest build now - a.k.a. เท„ූ เท„ූ, AWS!

SLAppForge Sigma cloud IDE - for an ultra-fast serverless ride! (courtesy of Pexels)

Building a deployable serverless code artifact is a key functionality of our SLAppForge Sigma cloud IDE - the first-ever, completely browser-based solution for serverless development. The faster the serverless build, the sooner you can get along with the deployment - and the sooner you get to see your serverless application up and running.

AWS was "slow" too - but then came Quick Build.

During early days, back when we supported only AWS, our mainstream build was driven by CodeBuild. This had several drawbacks; it usually took 10-20 seconds for the build to complete, and it was rather repetitive - cloning the repo and downloading dependencies each time. Plus, you only get 100 free build minutes per month, so it adds a bit of a cost - despite small - to ourselves, as well as to our users.

Then we noticed that we only need to modify the previous build artifact in order to get the new code rolling. So I wrote a "quick build"; basically a Lambda that downloads the last build artifact, updates the zipfile with the changed code files, and re-uploads it as the current artifact. This was accompanied by a "quick deploy" that directly updates the code of affected functions, thereby avoiding the overhead of a complete CloudFormation deployment.

Then our ex-Adroit wizard Chathura built a test environment, and things changed drastically. The test environment (basically a warm Lambda, replicating the content of the user's project) already had everything; all code files and dependencies, pre-loaded. Now "quick build" was just a matter of zipping everything up from within the test environment itself, and uploading it to S3; just one network call instead of two.

GCP build - still in stone age?

When we introduced GCP support, the build was again based on their Cloud Build, a.k.a. Container Builder service. Although GCP did offer 3600(!) free build minutes per month (120 each day; see what I'm talking, AWS?), theirs was generally slower than CodeBuild. So, for several months, Sigma's GCP support had the bad reputation of having the slowest build-deployment cycle.

But now, it is no longer the case.

Wait, what? It only needs code - no dependencies?

There's a very interesting characteristic of Cloud Functions:

When you deploy your function, Cloud Functions installs dependencies declared in the package.json file using the npm install command.

-Google Cloud Functions: Specifying dependencies in Node.js

This means, for deploying, you just have to upload a zipfile containing the sources and a dependencies file (package.json, requirements.txt and the like). No more npm install, or megabyte-sized bundle uploads.

But, the coolest part is...

... you can do it completely within the browser!

jszip FTW!

That awesome jszip package does it all for us, in just a couple lines:

let zip = new JSZip();

files.forEach(file => zip.file(file.name, file.code));

/*
a bit more complex, actually - e.g. for a nested file 'folder/file'
zip.folder(folder.name).file(file.name, file.code)
*/

let data = await zip.generateAsync({
 type: "string",
 streamFiles: true,
 compression: "DEFLATE"
});

We just zip up all code files in our project, plus the Node/npm package.json and/or Python/pip requirements.txt...

...and upload them to a Cloud Storage bucket:

let bucket = "your-bucket-name";
let key = "path/to/upload";

gapi.client.request({
 path: `/upload/storage/v1/b/${bucket}/o`,
 method: "POST",
 params: {
  uploadType: "media",
  name: key
 },
 headers: {
  "Content-Type": "application/zip",
  "Content-Encoding": "base64"
 },
 body: btoa(data)
})).then(res => {
 console.debug("GS upload successful", res);

 return {
  Bucket: res.result.bucket,
  Key: res.result.name
 };
});

Now we can add the Cloud Storage object path into our Deployment Manager template right away!

...
{
 "name": "goofunc",
 "type": "cloudfunctions.v1beta2.function",
 "properties": {
  "function": "goofunc",
  "sourceArchiveUrl": "gs://your-bucket-name/path/to/upload",
  "entryPoint": ...
 }
}

So, how fast is it - for real?

  1. jszip runs in-memory and takes just a few millis - as expected.
  2. If it's the first time after the IDE is loaded, the Google APIs JS client library takes a few seconds to load.
  3. After that, it's a single Cloud Storage API call - to upload our teeny tiny zipfile into our designated Cloud Storage bucket sigma-slappforge-{your Cloud Platform project name}-build-artifacts!
  4. If the bucket is not yet available, and the upload fails as a result, we have two more steps - create the bucket and then re-run the upload. This happens only once in a lifetime.

So for a routine serverless developer, skipping steps 2 and 4, the whole process takes around just one second - the faster your network, the faster it all is!

In comparison to AWS builds, where we want to first run a dependency sync and then a build (each of which is preceded by HTTP OPTIONS requests, thanks to CORS restrictions); this is lightning fast!

(And yeah, this is one of those places where the googleapis client library shines; high above aws-sdk.)

Enough reading - let's roll!

I am a Google Cloud fan by nature - perhaps because my "online" life started with Gmail, and my "cloud dev" life started with Google Apps Script and App Engine. So I'm certainly at bias here.

Still, when you really think about it, Google Cloud is way simpler far more organized than AWS. While this could be a disadvantage when it comes to advanced serverless apps - say, "how do I trigger my Cloud Function periodically?" - GCF is pretty simple, easy and fast. Very much so, when all you need is a serverless HTTP endpoint (webhook) or bucket/queue consumer up and running in a few minutes.

And, when you do that with Sigma IDE, that few minutes could even drop down to a matter of seconds - thanks to the brand new quick build!

So, why waste time reading this - when you can just go and do it right away?!

Monday, September 16, 2019

Sigma IDE now supports Python serverless Lambda functions!

Think Serverless, go Pythonic - all in your browser!

Python. The coolest, craziest, sexiest, nerdiest, most awesome language in the world.

(Okay, this news is several weeks stale, but still...)

If you are into this whole serverless "thing", you might have noticed us, a notorious bunch at SLAppForge, blabbering about a "serverless IDE". Yeah, we have been operating the Sigma IDE - the first of its kind - for quite some time now, getting mixed feedback from users all over the world.

Our standard feedback form had a question, "What is your preferred language to develop serverless applications?"; with options Node, Java, Go, C#, and a suggestion box. Surprisingly (or perhaps not), the suggestion box was the most popular option; and except for two, all other "alternative" options were one - Python.

User is king; Python it is!

We even had some users who wanted to cancel their brand new subscription, because Sigma did not support Python as they expected.

So, in one of our roadmap meetings, the whole Python story came out; and we decided to give it a shot.

Yep, Python it is!

Before the story, some credits are in order.

Hasangi, one of our former devs, was initially in charge of evaluating the feasibility of supporting Python in Sigma. After she left, I took over. Now, at this moment of triumph, I would like to thank you, Hasangi, for spearheading the whole Pythonic move. ๐Ÿ‘

Chathura, another of our former wizards, had tackled the whole NodeJS code analysis part of the IDE - using Babel. Although I had had some lessons on abstract syntax trees (ASTs) in my compiler theory lectures, it was after going through his code that I really "felt" the power of an AST. So this is to you, Chathura, for giving life to the core of our IDE - and making our Python journey much, much faster! ๐Ÿ––

And thank you Matt - for filbert.js!

Chathura's work was awesome; yet, it was like, say, "water inside water" (heck, what kind of analogy is that?). In other words, we were basically parsing (Node)JS code inside a ReactJS (yeah, JS) app.

So, naturally, our first question - and the million-dollar one, back then - was: can we parse Python inside our JS app? And do all our magic - rendering nice popups for API calls, autodetecting resource use, autogenerating IAM permissions, and so on?

Hasangi had already hunted down filbert.js, a derivative of acorn that could parse Python. Unfortunately, before long, she and I learned that it could not understand the standard (and most popular) format of AWS SDK API calls - namely named params:

s3.put_object(
  Bucket="foo",
  Key="bar",
  Body=our_data
)

If we were to switch to the "fluent" format instead:

boto.connect_s3() \
  .get_bucket("foo") \
  .new_key("bar") \
  .set_contents_from_string(our_data)

we would have to rewrite a whole lotta AST parsing logic; maybe a whole new AST interpreter for Python-based userland code. We didn't want that much of adventure - not yet, at least.

Doctor Watson, c'mere! (IT WORKS!!)

One fine evening, I went ahead to play around with filbert.js. Glancing at the parsing path, I noticed:

...
    } else if (!noCalls && eat(_parenL)) {
      if (scope.isUserFunction(base.name)) {
        // Unpack parameters into JavaScript-friendly parameters, further processed at runtime
        var pl = parseParamsList();
...
        node.arguments = args;
      } else node.arguments = parseExprList(_parenR, false);
...

Wait... are they deliberately skipping the named params thingy?

What if I comment out that condition check?

...
    } else if (!noCalls && eat(_parenL)) {
//    if (scope.isUserFunction(base.name)) {
        // Unpack parameters into JavaScript-friendly parameters, further processed at runtime
        var pl = parseParamsList();
...
        node.arguments = args;
//    } else node.arguments = parseExprList(_parenR, false);
...

And then... well, I just couldn't believe my eyes.

Two lines commented out, and it already started working!

That was my moment of truth. I am gonna bring Python into Sigma. No matter what.

Yep. A Moment of Truth.

I just can't give up. Not after what I just saw.

The Great Refactor

When we gave birth to Sigma, it was supposed to be more of a PoC - to prove that we can do serverless development without a local dev set-up, dashboard and documentation round-trips, and a mountain of configurations.

As a result, extensibility and customizability weren't quite in our plate back then. Things were pretty much bound to AWS and NodeJS. (And to think that we still call 'em "JavaScript" files... ๐Ÿ˜)

So, starting from the parser, a truckload of refactoring was awaiting my eager fingers. Starting with a Language abstraction, I gradually worked my way through editor and pop-up rendering, code snippet generation, building the artifacts, deployment, and so forth.

(I had tackled a similar challenge when bringing in Google Cloud support to Sigma - so I had a bit of an idea on how to approach the whole thing.)

Test environment

Ever since Chathura - our ex-Adroit wizard - implemented it single-handedly, the test environment was a paramount one among Sigma's feature set. If Python were to make an impact, we were also gonna need a test environment for Python.

Things start getting a bit funky here; thanks to its somewhat awkward history, Python has two distint "flavours": 2.7 and 3.x. So, in effect, we need to maintain two distinct environments - one for each version - and invoke the correct one based on the current function's runtime setting.

(Well now, in fact we do have the same problem for NodeJS as well (6.x, 8.x, 10.x, ...); but apparently we haven't given it much thought, and it hasn't caused any major problems as well! ๐Ÿ™)

pip install

We also needed a new contraption for handling Python (pip) dependencies. Luckily pip was already available on the Lambda container, so installation wasn't a major issue; the real problem was that they had to be extracted right into the project root directory in the test environment. (Contrary to npm, where everything goes into a nice and manageable node_modules directory - so that we can extract and clean up things in one go.) Fortunately a little bit of (hopefully stable!) code, took us through.

`pip`, and the Python Package Index

Life without __init__.py

Everything was running smoothly, until...

from subdirectory.util_file import util_func
  File "/tmp/pypy/ding.py", line 1, in <module>
    from subdirectory.util_file import util_func
ImportError: No module named subdirectory.util_file

Happened only in Python 2.7, so this one was easy to figure out - we needed an __init__.py inside subdirectory to mark it as an importable module.

Rather than relying on the user to create one, we decided to do it ourselves; whenever a Python file gets created, we now ensure that an __init__.py also exists in its parent directory; creating an empty file if one is absent.

Dammit, the logs - they are dysfunctional!

SigmaTrail is another gem of our Sigma IDE. When writing a Lambda piece by piece, it really helps to have a logs pane next to your code window. Besides, what good is a test environment, if you cannot see the logs of what you just ran?

Once again, Chathura was the mastermind behind SigmaTrail. (Well, yeah, he wrote more than half of the IDE, after all!) His code was humbly parsing CloudWatch logs and merging them with LogResults returned by Lambda invocations; so I thought I could just plug it in to the Python runtime, sit back, and enjoy the view.

I was terribly wrong.

Raise your hand, those who use logging in Python!

In Node, the only (obvious) way you're gonna get something out in the console (or stdout, technically) is via one of those console.{level}() calls.

But Python gives you options - say the builtin print, vs the logging module.

If you go with logging, you have to:

  1. import logging,
  2. create a Logger and set its handler's level - if you want to generate debug logs etc.
  3. invoke the appropriate logger.{level} or logging.{level} method, when it comes to that

Yeah, on Lambda you could also

context.log("your log message\n")

if you have your context lying around - still, you need that extra \n at the end, to get it to log stuff to its own line.

But it's way easier to just print("your log message") - heck, if you are on 2.x, you don't even need those braces!

Good for you.

But that poses a serious problem to SigmaTrail.

Yeah. We have a serious problem.

All those print lines, in one gook of text. Yuck.

For console.log in Node, Lambda automagically prepends each log with the current timestamp and request ID (context.awsRequestId). Chathura had leveraged this data to separate out the log lines and display them as a nice trail in SigmaTrail.

But now, with print, there were no prefixes. Nothing was getting picked up.

Fixing this was perhaps the hardest part of the job. I spent about a week trying to understand the code (thanks to the workers-based pattern); and then another week trying to fix it without breaking the NodeJS flow.

By now, it should be fairly stable - and capable of handling any other languages that could be thrown at it as time passes by.

The "real" runtime: messing with PYTHONPATH

After the test environment came to life, I thought all my troubles were over. The "legacy" build (CodeBuild-driven) and deployment were rather straightforward to refactor, so I was happy - and even about to raise the green flag for an initial release.

But I was making a serious mistake.

I didn't realize it, until I actually invoked a deployed Lambda via an API Gateway trigger.

{"errorMessage": "Unable to import module 'project-name/func'"}

What the...

Unable to import module 'project-name/func': No module named 'subdirectory'

Where's ma module?

The tests work fine! So why not production?

After a couple of random experiments, and inspecting Python bundles generated by other frameworks, I realized the culprit was our deployment archive (zipfile) structure.

All other bundles have the functions at top level, but ours has them inside a directory (our "project root"). This wasn't a problem for NodeJS so far; but now, no matter how I define the handler path, AWS's Python runtime fails to find it!

Changing the project structure would have been a disaster; too much risk in breaking, well, almost everything else. A safer idea would be to override one of the available settings - like a Python-specific environmental variable - to somehow get our root directory on to PYTHONPATH.

A simple hack

Yeah, the answer is right there, PYTHONPATH; but I didn't want to override a hand-down from AWS Gods, just like that.

So I began digging into the Lambda runtime (yeah, again) to find if there's something I could use:

import os

def handler(event, context):
    print(os.environ)

Gives:

{'PATH': '/var/lang/bin:/usr/local/bin:/usr/bin/:/bin:/opt/bin',
'LD_LIBRARY_PATH': '/var/lang/lib:/lib64:/usr/lib64:/var/runtime:/var/runtime/lib:/var/task:/var/task/lib:/opt/lib',
...
'LAMBDA_TASK_ROOT': '/var/task',
'LAMBDA_RUNTIME_DIR': '/var/runtime',
...
'AWS_EXECUTION_ENV': 'AWS_Lambda_python3.6', '_HANDLER': 'runner_python36.handler',
...
'PYTHONPATH': '/var/runtime',
'SIGMA_AWS_ACC_ID': 'nnnnnnnnnnnn'}

LAMBDA_RUNTIME_DIR looked like a promising alternative; but unfortunately, AWS was rejecting it. Each deployment failed with the long, mean error:

Lambda was unable to configure your environment variables because the environment variables
you have provided contains reserved keys that are currently not supported for modification.
Reserved keys used in this request: LAMBDA_RUNTIME_DIR

Nevertheless, that investigation revealed something important: PYTHONPATH in Lambda wasn't as complex or crowded as I imagined.

'PYTHONPATH': '/var/runtime'

And apparently, Lambda's internal agents don't mess around too much with it. Just pull out and read /var/runtime/awslambda/bootstrap.py and see for yourself. ๐Ÿ˜Ž

PYTHONPATH works. Phew.

It finally works!!!

So I ended up overriding PYTHONPATH, to include the project's root directory, /var/task/project-name (in addition to /var/runtime). If you want something else to appear there, feel free to modify the environment variable - but leave our fragment behind!

On the bright side, this should mean that my functions should work in other platforms as well - since PYTHONPATH is supposed to be cross-platform.

Google Cloud for Python - Coming soon!

With a few tune-ups, we could get Python working on Google Cloud Functions as well. It's already in our staging environment; and as soon as it goes live, you GCP fellas would be in luck! ๐ŸŽ‰

Still a long way to go... But Python is already alive and kicking!

You can enjoy writing Python functions in our current version of the IDE. Just click the plus (+) button on the top right of the Projects pane, select New Python Function File (or New Python File), and let the magic begin!

And of course, let us - and the world - know how it goes!

Sunday, April 22, 2018

Deploying your stuff with Google Cloud Deployment Manager: via NodeJS

This may not be the correct way; heck, this may be the crappiest way. I'm putting this up because I could not find a single decent sample on how to do it with JS.

The approach in this post uses NodeJS (server-side), but it is possible to do the same on the client side by loading the Google API client and subsequently the deploymentmanager v2 module; I'll write about it as well, if/when I get a chance.

First you set up authentication so your googleapis client can obtain a token automatically.

Assuming that you have added the googleapis:28.0.1 NPM module to your dependencies list, and downloaded your service account key into the current directory (where the deploymentmanager-invoking code is residing):

const google = require("googleapis").google;

const key = require("./keys.json");
const jwtClient = new google.auth.JWT({
    email: key.client_email,
    key: key.private_key,
    scopes: ["https://www.googleapis.com/auth/cloud-platform"]
});
google.options({auth: jwtClient});

I used a service account, so YMMV.

If you like, you can cache the token at dev time by adding some more gimmicks: I used axios-debug-log to intercept the auth response and persist the token to a local file, from which I read the token during subsequent runs (if the token expires the JWT client will automatically refresh it, which I will then persist):

process.env.log = "axios";
const tokenFile = "./token.json";
require("axios-debug-log")({
    // disable extra logging
    request: function (debug, config) {},
    error: function (debug, error) {},
    response: function (debug, response) {
        // grab and save access token for reuse
        if (response.data.access_token) {
            console.log("Updating token");
            require("fs").writeFile(tokenFile, JSON.stringify(response.data));
        }
    },
});

// load saved token; if success, use OAuth2 client with loaded token instead of JWT client
// (avoid re-auth at each run)
try {
    const token = require(tokenFile);
    if (!token.access_token) {
        throw Error("no token found");
    }
    token.refresh_token = token.refresh_token || "refreshtoken";    //mocking
    console.log("Using saved tokens from", tokenFile);
    jwtClient.setCredentials(token);
} catch (e) {
    console.log(e.message);
}

Fair enough. Now to get the current state of the deployment:

const projectId = "your-gcp-project-id";
const deployment = "your-deployment-name";

const deployments = google.deploymentmanager("v2").deployments;

let fingerprint = null;

let deployment = deployments.get({
    project: projectId,
    deployment: deployment
})
    .then(response => {
        fingerprint = response.data.fingerprint;
        console.log("Fingerprint", fingerprint);
        return Promise.resolve(response);
    })
    .then(response => {
        // continue the logic
    });

The "fingerprint logic" is needed because we need to pass a "fingerprint" to every "write" (update (preview/start), stop, cancelPreview etc.) operation in order to guarantee in-order execution and operation synchronization.

That done, we set up an update for our deployment by creating a deployment preview (shell) within the last .then():

    .then(response => {
        console.log("Creating deployment preview", deployment);
        return deployments.update({
            project: projectId,
            deployment: deployment,
            preview: true,
            resource: {
                name: deployment,
                fingerprint: fingerprint,
                target: {
                    config: {
                        content: JSON.stringify({
                            resources: [
                                /* your resource definitions here; e.g.

                                {
                                    name: "myGcsBucket",
                                    type: "storage.v1.bucket",
                                    properties: {
                                        storageClass: "STANDARD",
                                        location: "US",
                                        labels: {
                                            "keyOne": "valueOne"
                                        }
                                    }
                                }
                                
                                and so on */
                            ]
                        }, 4, 2)
                    }
                }
            }
        })
            .catch(e => err("Failed to preview deployment", e))
    })

// small utilty function for one-line throws

const err = (msg, e) => {
    console.log(`${msg}: ${e}`);
    throw e;
};

Notice that we passed fingerprint as part of the payload. Without it, Google would complain that it expected one.

But now, we again need to call deployments.get() because the fingerprint would have been updated! (Why the heck doesn't Google return the fingerprint in the response itself?!)

Maybe it's easier to just wrap the modification calls inside a utility code snippet:

const filter = {
    project: projectId,
    deployment: deployment
};

const ensureFingerprint = promise =>
    promise
        .then(response => deployments.get(filter))
        .then(response => {
            fingerprint = response.data.fingerprint;
            console.log("Fingerprint", fingerprint);
            return Promise.resolve(response);
        });

// ...

let preview = ensureFingerprint(Promise.resolve(null))   // only obtain the fingerprint
    .then(response => {
        console.log("Creating deployment preview", deployment);
        return ensureFingerprint(deployments.update({
            // same payload from previous code block
        }))
            .catch(e => err("Failed to preview deployment", e))
    })

True, it's nasty to have a global fingerprint variable. You can pick your own way.

Meanwhile, if the initial deployments.get() fails due to a deployment being not found by the given name, we can create one (along with a preview) right away:

    .catch(e => {
        // fail unless the error is a 'not found' error
        if (e.code === 404) {
            console.log("Deployment", deployment, "not found, creating");
            return ensureFingerprint(deployments.insert({
                // identical to deployments.create(), except for missing fingerprint
                project: projectId,
                deployment: deployment,
                preview: true,
                resource: {
                    name: deployment,
                    target: {
                        config: {
                            content: JSON.stringify({
                                resources: [
                                    // your resource definitions here
                                ]
                            }, 4, 2)
                        }
                    }
                }
            }))
                .catch(e => err("Deployment creation failed", e));
        } else {
            err("Unknown failure in previewing deployment", e);
        }
    });

Now let's keep on "monitoring" the preview until it reaches a stable state (DONE, CANCELLED etc.):

// small utility to run a timer task without multiple concurrent requests

const startTimer = (func, timer, period) => {
    let caller = () => {
        func().then(repeat => {
            if (repeat) {
                timer.handle = setTimeout(caller, period);
            }
        });
    };
    timer.handle = setTimeout(caller, period);
};

let timer = {
    handle: null
};
preview.then(response => {
    console.log("Starting preview monitor", deployment);
    startTimer(() => {
        return deployments.get(filter)
            .catch(e => {
                //TODO detect and ignore temporary failures
                err("Unexpected error in monitoring preview", e);
            })
            .then(response => {
                let op = response.data.operation;
                let status = op.status;
                console.log(status, "at", op.progress, "%");

            })
    }, timer, 5000);
});

And check if we reached a terminal (completion) state:

const SUCCESS_STATES = ["SUCCESS", "DONE"];
const FAILURE_STATES = ["FAILURE", "CANCELLED"];
const COMPLETE_STATES = SUCCESS_STATES.concat(FAILURE_STATES);

// ...

            .then(response => {
                // ...

                if (COMPLETE_STATES.includes(status)) {
                    console.log("Preview completed with status", status);
                    if (SUCCESS_STATES.includes(status)) {
                        if (op.error) {
                            console.error("Errors:", op.error);
                        } else {
                            
                        }
                    } else if (FAILURE_STATES.includes(status)) {
                        console.log("Preview failed, skipping deployment");
                    }
                    return false;
                }
                return true;

If we reach a success state, we can commence the actual deployment:

                        // ...
                        } else {
                            deploy();
                        }

// ...

const deploy = () => {
    let deployer = () => {
        console.log("Starting deployment", deployment);
        return deployments.update({
            project: projectId,
            deployment: deployment,
            preview: false,
            fingerprint: fingerprint,
            resource: {
                name: deployment
            }
        })
            .catch(e => err("Deployment startup failed", e))
    };

And start monitoring again, until we reach a completion state:

    // ...

    deployer().then(response => {
        console.log("Starting deployment monitor", deployment);
        startTimer(() => {
            return deployments.get(filter)
                .catch(e => {
                    //TODO detect and ignore temporary failures
                    err("Unexpected error in monitoring deployment", e);
                })
                .then(response => {
                    let op = response.data.operation;
                    let status = op.status;
                    console.log(status, "at", op.progress, "%");

                    if (COMPLETE_STATES.includes(status)) {
                        console.log("Deployment completed with status", status);
                        if (op.error) {
                            console.error("Errors:", op.error);
                        }
                        return false;  // stop
                    }
                    return true;  // continue
                })
        }, timer, 5000);
    });
};

Recap:

const SUCCESS_STATES = ["SUCCESS", "DONE"];
const FAILURE_STATES = ["FAILURE", "CANCELLED"];
const COMPLETE_STATES = SUCCESS_STATES.concat(FAILURE_STATES);

const google = require("googleapis").google;

const key = require("./keys.json");
const jwtClient = new google.auth.JWT({
    email: key.client_email,
    key: key.private_key,
    scopes: ["https://www.googleapis.com/auth/cloud-platform"]
});
google.options({auth: jwtClient});

const projectId = "your-gcp-project-id";
const deployment = "your-deployment-name";

// small utility to run a timer task without multiple concurrent requests

const startTimer = (func, timer, period) => {
    let caller = () => {
        func().then(repeat => {
            if (repeat) {
                timer.handle = setTimeout(caller, period);
            }
        });
    };
    timer.handle = setTimeout(caller, period);
};

// small utilty function for one-line throws

const err = (msg, e) => {
    console.log(`${msg}: ${e}`);
    throw e;
};

let timer = {
    handle: null
};

const deployments = google.deploymentmanager("v2").deployments;

const filter = {
    project: projectId,
    deployment: deployment
};

let fingerprint = null;
const ensureFingerprint = promise =>
    promise
        .then(response => deployments.get(filter))
        .then(response => {
            fingerprint = response.data.fingerprint;
            console.log("Fingerprint", fingerprint);
            return Promise.resolve(response);
        });

let preview = ensureFingerprint(Promise.resolve(null))   // only obtain the fingerprint
    .then(response => {
        console.log("Creating deployment preview", deployment);
        return ensureFingerprint(deployments.update({
            project: projectId,
            deployment: deployment,
            preview: true,
            resource: {
                name: deployment,
                fingerprint: fingerprint,
                target: {
                    config: {
                        content: JSON.stringify({
                            resources: [
                                // your resource definitions here
                            ]
                        }, 4, 2)
                    }
                }
            }
        }))
            .catch(e => err("Failed to preview deployment", e))
    })
    .catch(e => {
        // fail unless the error is a 'not found' error
        if (e.code === 404) {
            console.log("Deployment", deployment, "not found, creating");
            return ensureFingerprint(deployments.insert({
                // identical to deployments.create(), except for missing fingerprint
                project: projectId,
                deployment: deployment,
                preview: true,
                resource: {
                    name: deployment,
                    target: {
                        config: {
                            content: JSON.stringify({
                                resources: [
                                    // your resource definitions here
                                ]
                            }, 4, 2)
                        }
                    }
                }
            }))
                .catch(e => err("Deployment creation failed", e));
        } else {
            err("Unknown failure in previewing deployment", e);
        }
    });

preview.then(response => {
    console.log("Starting preview monitor", deployment);
    startTimer(() => {
        return deployments.get(filter)
            .catch(e => {
                //TODO detect and ignore temporary failures
                err("Unexpected error in monitoring preview", e);
            })
            .then(response => {
                let op = response.data.operation;
                let status = op.status;
                console.log(status, "at", op.progress, "%");

                if (COMPLETE_STATES.includes(status)) {
                    console.log("Preview completed with status", status);
                    if (SUCCESS_STATES.includes(status)) {
                        if (op.error) {
                            console.error("Errors:", op.error);
                        } else {
                            deploy();
                        }
                    } else if (FAILURE_STATES.includes(status)) {
                        console.log("Preview failed, skipping deployment");
                    }
                    return false;  // stop
                }
                return true;  // continue
            })
    }, timer, 5000);
});

const deploy = () => {
    let deployer = () => {
        console.log("Starting deployment", deployment);
        return deployments.update({
            project: projectId,
            deployment: deployment,
            preview: false,
            resource: {
                name: deployment,
                fingerprint: fingerprint
            }
        })
            .catch(e => err("Deployment startup failed", e))
    };

    deployer().then(response => {
        console.log("Starting deployment monitor", deployment);
        startTimer(() => {
            return deployments.get(filter)
                .catch(e => {
                    //TODO detect and ignore temporary failures
                    err("Unexpected error in monitoring deployment", e);
                })
                .then(response => {
                    let op = response.data.operation;
                    let status = op.status;
                    console.log(status, "at", op.progress, "%");

                    if (COMPLETE_STATES.includes(status)) {
                        console.log("Deployment completed with status", status);
                        if (op.error) {
                            console.error("Errors:", op.error);
                        }
                        return false;  // stop
                    }
                    return true;  // continue
                })
        }, timer, 5000);
    });
};

That should be enough to get you going.

Good luck!

Serverless is the new Build Server: Google CloudBuild (Container Builder) via NodeJS

Google's CloudBuild (a.k.a. "Container Builder") is an on-demand, container-based build service offered under the Google Cloud Platform (GCP). For you and me, it is a nice alternative to maintaining and paying for our own build server, and a clever addition to anyone's CI stack.

CloudBuild allows you to start from a source (e.g. a Google Cloud Source repo, a GCS bucket - or perhaps even nothing (a blank directory; "scratch"), incrementally apply several Docker container runs upon it, and publish the final result to a desired location: like a Docker repository or a GCS bucket.

With its wide variety of custom builders, CloudBuild can do almost anything - that is, as far as I see so far, anything that can be achieved by a Docker container and a volume mount can be fulfilled in CloudBuild as well. To our great satisfaction, this includes fetching sources from GitHub/BitBucket repos (in addition to the native source location options), running custom commands like zip, and much more!

Above all this (how nice of GCP!), CloudBuild gives you 2 whole hours (120 minutes) of build time per day, for free - in comparison to the comparable CodeBuild service of AWS, which offers just 1 hour and 40 minutes per month!

So, now let's have a look at how we can run a CloudBuild via JS (server-side NodeJS):

First things first: adding googleapis:28.0.1 to our dependency list;

{
  "dependencies": {
    "googleapis": "28.0.1"
  }
}

Don't forget the npm install!

In our logic flow, first we need to get ourselves authenticated; with the google-auth-library module that comes with googleapis, this is quite straightforward because the client can be fed with a JWT auth client right from the beginning, which will handle all the auth stuff behind the scenes:

const projectId = "my-gcp-project-id";

const google = require("googleapis").google;

const key = require("./keys.json");
const jwtClient = new google.auth.JWT({
    email: key.client_email,
    key: key.private_key,
    scopes: ["https://www.googleapis.com/auth/cloud-platform"]
});
google.options({auth: jwtClient});

Note that, for the above code to work verbatim, you need to place a service account key file in the current directory (usually obtained by creating a new service account via the Google Cloud console, in case you don't already have one).

Now we can simply retrieve the v1 version of the cloudbuild client from google, and start our magic:

const builds = google.cloudbuild("v1").projects.builds;

First we submit a build "spec" to the CloudBuild service. Below is an example for a typical NodeJS module on GitHub:

builds.create({
    projectId: projectId,
    resource: {
        steps: [
            {
                name: "gcr.io/cloud-builders/git",
                args: ["clone", "https://github.com/slappforge/slappforge-sdk", "."]
            },
            {
                name: "gcr.io/cloud-builders/npm",
                args: ["install"]
            },
            {
                name: "kramos/alpine-zip",
                args: [
                    "-q",
                    "-x", "package.json", ".git/", ".git/**", "README.md",
                    "-r",
                    "slappforge-sdk.zip",
                    "."
                ]
            },
            {
                name: "gcr.io/cloud-builders/gsutil",
                args: [
                    "cp",
                    "slappforge-sdk.zip",
                    "gs://sdk-archives/slappforge-sdk/$BUILD_ID/slappforge-sdk.zip"
                ]
            }
        ]
    }
})
    .catch(e => {
        throw Error("Failed to start build: " + e);
    })

Basically we retrieve the source from GitHub, fetch the dependencies via a npm install, bundle the whole thing using a zip command container (took me a while to figure it out, which is why I'm posting this!) and upload the resulting zip to a GCS bucket.

We can tidy this up a bit (and perhaps make the template reusable for subsequent builds, by extracting out the parameters into a substitutions section:

const repoUrl = "https://github.com/slappforge/slappforge-sdk";
const projectName = "slappforge-sdk";
const bucket = "sdk-archives";

builds.create({
    projectId: projectId,
    resource: {
        steps: [
            {
                name: "gcr.io/cloud-builders/git",
                args: ["clone", "$_REPO_URL", "."]
            },
            {
                name: "gcr.io/cloud-builders/npm",
                args: ["install"]
            },
            {
                name: "kramos/alpine-zip",
                args: [
                    "-q",
                    "-x", "package.json", ".git/", ".git/**", "README.md",
                    "-r",
                    "$_PROJECT_NAME.zip",
                    "."
                ]
            },
            {
                name: "gcr.io/cloud-builders/gsutil",
                args: [
                    "cp",
                    "$_PROJECT_NAME.zip",
                    "gs://$_BUCKET_NAME/$_PROJECT_NAME/$BUILD_ID/$_PROJECT_NAME.zip"
                ]
            }
        ],
        substitutions: {
            _REPO_URL: repoUrl,
            _PROJECT_NAME: projectName,
            _BUCKET_NAME: bucket
        }
    }
})
    .catch(e => {
        throw Error("Failed to start build: " + e);
    })

Once the build is started, we can monitor it like so (with a few, somewhat neat wrappers to properly manage the timer logic):

    .then(response => {
        let timer = {
            handle: null
        };

        startTimer(() => {
            return builds.get({
                projectId: projectId,
                id: response.data.metadata.build.id
            })
                .catch(e => {
                    throw e;
                })
                .then(response => {
                    const COMPLETE_STATES = ["SUCCESS", "DONE", "FAILURE", "CANCELLED"];
                    if (COMPLETE_STATES.includes(response.data.status)) {
                        return false;
                    }
                    return true;
                })
        }, timer, 5000);
    });

// small utility to run a timer task without multiple concurrent requests

const startTimer = (func, timer, period) => {
    let caller = () => {
        func().then(repeat => {
            if (repeat) {
                timer.handle = setTimeout(caller, period);
            }
        });
    };
    timer.handle = setTimeout(caller, period);
};

Once the build reaches a steady state, you are done!

If you want fine-grained details, just dig into response.data within the timer callback blocks.

Happy CloudBuilding!