Showing posts with label FaaS. Show all posts

Wednesday, June 24, 2020

Get Notified on Slack for your CloudWatch/Lambda Error Logs: The Sigma Way

Originally written for The SLAppForge Blog; Jun 22, 2020

Slack is already the de-facto "channel" for team collaboration as well as low-to-moderate scale event monitoring and notifications. When we started working on the world's first serverless MFT platform, we decided we should go down the Slack path for first-level monitoring; similar to how we already do it efficiently with our conventional AS2 Gateway.

Not really real-time - and no need to be

When you mention Slack, real-time usually comes to mind; however when it comes to monitoring, real-time often becomes a PITA. Especially when a new user is trying out our platform and making tons of mistakes; or when an AS2 partner endpoint goes down, and our outgoing messages start failing in dozens by the second (all of them are accounted for, so there's really no need - and nothing - to do on our end).

Of course the correct way to handle these critical ("database is down!") vs non-critical (temporary endpoint failure, like above) errors, is via proper prioritization on the reporting end. However, until we have such a mechanism in place, we wanted to receive batched summaries of errors; at a high-enough frequency so that we can still act on them in time (before the user abandons us and moves on!).

Serverless logging: a natural candidate for batched reporting

In AS2 Gateway we didn't have much luck with batching (yet), because the Slack publisher was a standard Log4J2 appender. If we wanted to batch things up, we would have to do it ourselves within the appender - bringing in queueing, and dragging in a host of other issues along with it.

But in MFT Gateway everything is distributed and abstracted out - Lambda, API Gateways, Step Functions, and so on. There is no badass "Slack appender"; all logs go into one sink, CloudWatch, neatly arranged across log groups and streams.

So we need to come up with a relatively passive system (unlike before, where the appender - part of the application itself - does the alerting for us, as soon as the events have occurred). Either CloudWatch has to push events to us, or we have to pull events from them.

Some native, push-based alternatives - that (alas) didn't work

In fact, initially we did research upon possible ways to get CloudWatch - or one of its own supported sinks a.k.a. downstreams - to push alerts to us; but that didn't turn out as good as we thought:

  • CloudWatch Alarms are state-transition-based; once the alarm "rings" (goes red) and fires an alert, it won't ring again until the system returns to an "okay" (green) state. The obvious caveat is that, if multiple errors occur over a short period of time, we would get notified only for the first one. Consequently, if we were to not risk missing out on any errors, we would have to keep on monitoring the logs after each alarm - until the alarm itself goes back green. (We could set up multiple alarms for different kinds of errors; but that's not very scalable with application evolution - and not budget-friendly at all, at $0.30 per each high-resolution alarm).
  • Triggering a Lambda Function via CloudWatch Logs was also an option. But it didn't make much sense (neither from scalability nor from financial perspectives) because it didn't provide a sufficient batching scope (let's say it was "too real-time"); if our original (application) Lambda produced 100 error logs within a minute, we might potentially even end up with 100 monitoring Lambda invocations! (And I'm pretty sure that it wasn't offering filtering as well, the last time we checked 🤔 which would have been a disaster, needless to say.)
  • Draining Logs to Kinesis was another option; however this involves the hourly charges of a Kinesis stream, in addition to the need for an actual processing component (perhaps a Lambda, again) to get alerts into Slack.
  • Aggregating Logs into Elasticsearch was the final one; obviously we didn't want to take that path because it would shamefully add a server component to our serverless platform (true, with AWS it's a managed service; but having to pay a hourly fee took that feeling away from us 😎); besides, running Elasticsearch just to get error alerts sounded a bit overkill as well.

Lambda pull: final call

So we ended up with an old-school, pull-based approach - with the Lambda running once every few minutes, polling a set of log groups for WARN and ERROR logs over the last few minutes (incidentally, since the previous run of the same Lambda), and sending these (if any) to our Slack channel in one big batched-up "report" message.

Good news: you can deploy it on your own AWS account - right now!

We used our own dog food, the Sigma IDE - the one and only serverless IDE, purpose-built for serverless developers. We kept all necessary configuration parameters in environment variables, so that you can simply fill them up with values matching your own infra - and deploy it to your own AWS account in one click.

But the best part is...

...you don't need anything else to do it!

I bet you're reading this article on a web browser;

  1. fire up Sigma in the next tab,
  2. log in and provide your AWS credentials, if not already done,
  3. open the ready-made project by simply entering its GitHub URL https://github.com/janakaud/cloudwatch-slack-alerts,
  4. fill in the environment variables, and
  5. click Deploy Project!

Zero tools to download, packages/dependencies to install, commands to run, config files to edit, bundles to zip-up and upload, ...

But for the inquisitive reader, doesn't that kill the fun part?

Even so, some of you might be curious as to how it all works. Curiosity kills cats, but after all that's what makes us builders and developers; won't you say? 😎

The Making-of: a ground-up overview of the Slack alert reporter

First, a Word of Warning

The permission customization feature used here may not be available for free accounts. However as mentioned before, you can still open the ready-made project from GitHub and deploy it right away - and tweak _any other_ aspects (code, libraries, trigger frequency, function configs etc.) - using a free Sigma account. We do have plans to open up the permission manager and template editor to the free tier; so, depending on the time you are reading this, you may be lucky!

If you need to "just get the damn thing deployed", skip back to the Good news: section - right away!

Preparation

  1. Integrate the Incoming Webhooks app with your Slack workspace.
  2. When integration is complete, grab the webhook integration URL from the final landing page.
  3. Create a suitable Slack channel to receive your alerts.
  4. Make a list of log group names that you need to check for alert-worthy events.
  5. Decide on a pattern to check (filter) the logs for alerts - you can use any of the standard syntaxes supported by CloudWatch Logs API.
  6. Decide how frequently you want to poll the log groups - this will go into the Lambda trigger as well as a code-level "look-behind" parameter which we'll use when calling the API.

The plan

  1. Set up a CloudWatch Events scheduled trigger to run the Lambda at a desired time period
  2. Parallelly poll each log group for new logs matching our pattern, within the look-behind window - which should ideally the same as the trigger period (e.g. if your Lambda runs once in every 5 minutes, checking the last 5 minutes of logs in each cycle should suffice).
  3. Filter out empty results and build a string "report" with events categorized by log group name
  4. Post the report to the Slack channel via the webhook.

Before you start coding

  1. Sign in to Sigma IDE and create a new NodeJS AWS project. (We could have used Python as well, but would have had to handle _parallelism_ ourselves.)
  2. If you don't like the default file name (which gets opened as soon as you land in the editor), change it - and its Function Name - to something else.
  3. Unless you like the native http module, add a dependency to make the webhook call; we picked axios.

Environment variables

Add a few of 'em, as follows:

  • POLL_PERIOD_MS: the "look-behind" period for the log query (in millis) - for the current implementation, it should be the same as what you set for the period of the timer trigger (below).
  • LOG_GROUPS: a space-separated list of log groups that you need to check; if a group is not prefixed with a namespace (e.g. /aws/apigateway/ it will default to /aws/lambda/
  • LOG_PATTERN: the search pattern to "filter in" the alert-worthy logs; ?ERROR ?WARN ("at least one of ERROR and WARN") could be good enough to capture all errors and warnings (depends on your internal logging formats, of course)
  • SLACK_WEBHOOK_URL: speaks for itself; the webhook URL you grabbbed during Preparation
  • SLACK_CHANNEL: again, trivial; the "hashname" (maybe #bada_boom) of the channel you created earlier
  • SLACK_USER: the name of the user (bot) that the alerts would appear to be coming from

There are other cool features supported by the Incoming Webhooks integration; a few small tweaks in the webhook-invocation part, and you could be swimming in 'em right away.

Except the first one, you may need to prevent values of these variables from being persisted into version control when you save the project; in Sigma, you can make their values non-persistent with a simple flip of a switch.

When you reopen the project after a decade, Sigma will automagically pull them in from the deployed Lambdas, and populate the values for you - so you won't need to rack your notes (or brains) to recall the values either!

The timer (CloudWatch scheduled) trigger

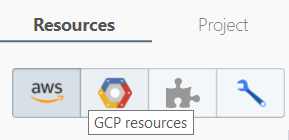
  1. Drag-n-drop a CloudWatch Events trigger from the Resources pane on the left, on to the event variable of the function header.
  2. Under New RuleSchedule tab, enter the desired run frequency as a rate expression (e.g. rate(5 minutes)). You can also use a cron if desired, but it may be a bit trickier to compute the look-behind window in that case.
  3. Click Inject.

And now, the cool stuff - the code!

Let's quickly go through the salient bits and pieces:

Poll the log groups asynchronously

This transforms any returned log events (matching our time range and filter pattern) into a formatted "report string":

logGroupName

some log line matching ERROR or WARN (in the group's own logging format)

another line

another one

...

and returns it (or null if nothing was found):

// if not namespaced, add default Lambda prefix
let logGroupName = g.indexOf("/") < 0 ? `/aws/lambda/${g}` : g;

let msg, partial = true;
try {
	let data = await logs.filterLogEvents({
		logGroupName,
		filterPattern,
		startTime,
		limit: 100
	}).promise();
	msg = data.events.map(e => e.message.substring(0, 1000).trim()).join("\n\n");
	partial = !!data.nextToken;
} catch (e) {
	msg = `Failed to poll ${g}; ${e.message}`;
}
return msg.length > 0 ? `\`${g}${partial ? " [partial]" : ""}\`

\`\`\`
${msg}
\`\`\`` : null;

Fan-out and aggregate across log groups

We can poll each log group independently to save time, and merge everything into a final, time-prefixed report - ready to post to Slack:

let checks = groups.map(async g => {
	// the code we saw above
});

return await Promise.all(checks)
	.then(msgs => {
		let valid = msgs.filter(m => !!m);
		if (valid.length > 0) {
			postMsg(`*${timeStr}*

${valid.join("\n\n")}`);
		}
	})
	.catch(e => postMsg(`*FAULT* ${timeStr}

\`\`\`
${e.message}
\`\`\``));
};

Post it to the Slack webhook

const postMsg = text => {
	return axios.post(hook, {
		channel, username,
		text,
		icon_emoji: ":ghost:"
	});
};

Putting it all together

Throw in the imports, client declarations, a bit of sanity (esp. around environment variable loading), and some glue - and you have your full-blown Lambda!

See it in GitHub - in all its raw glamour.

CloudWatch Logs IAM permissions

Since our Lambda is going to access CloudWatch Logs API (for which Sigma does not auto-generate permissions yet), we need to add a permission entry to the Lambda's IAM policy:

{
  "Version": "2012-10-17",
  "Statement": [
    {
      "Effect": "Allow",
      "Resource": [
        {
          "Fn::Sub": "arn:aws:logs:${AWS::Region}:${AWS::AccountId}:log-group:*"
        }
      ],
      "Action": [
        "logs:FilterLogEvents"
      ]
    }
  ]
}

In this case we've granted access to all log groups; depending on your monitoring scope you may be able to further narrow it down using the ARN pattern on the Resource entry.

If you're following along on the free tier, the Custom Permissions tab may not be editable for you - depending on when you're reading this. Regardless, as mentioned before, that won't prevent you from opening, modifying and deploying the already-tuned-up project from GitHub!

Deploy it!

That one's easy - just click the Deploy Project button on the IDE toolbar!

Within a few seconds, Sigma will show you a deployment progress dialog, and give the green light ("successfully deployed") shortly afterwards - usually in under a minute.

Okay, the Slack reporter is live. And now...

All that's left to do is to sit back and relax - while the Lambda churns your CloudWatch logs and alerts you of any fishy stuff that it finds!

Bonus: some troubleshooting tips, just in case

If you don't receive anything on Slack (even when clearly there are error logs within the last few minutes), or notice some other weird behavior (like duplicate/repeated alerts), it may be time to check the logs of the log-polling Lambda itself 😎

You can just pop the in-IDE SigmaTrail log viewer and view the latest execution logs ([PROD]) of the Lambda, or use the CLI (aws logs filter-log-events --log-group-name /aws/lambda/YourLambdaNameHere) or the web console to view 'em officially from AWS side.

The default code will log a line during each run, indicating the starting timestamp (from which point in time it is checking for new logs, within the current cycle); this could be handy to determine when the function has run, and what "log ground" it has covered.

Stay in touch!

Lambda is cool, and serverless is super-cool - given all the things you can accomplish, even without using Lambda!

So stay tuned for more serverless goodies - from the pioneers in serverless dev-tools 😎

Serverless Monitoring: What do we Monitor when the Server Goes Away?

Originally written for The SLAppForge Blog; Feb 17, 2020

Monitoring your serverless application is crucial - especially while it is handling your production load. This brings us to today's topic, how to effectively monitor a serverless application.

Serverless = Ephemeral

Serverless environments are inherently ephemeral; once the execution completes, you don't have much left behind to investigate.

There's so much exciting talk about container reuse and keep-warm, but theoretically every single one of your function could be a cold-start. Even with reuse, you don't get access to the environment to analyze the previous invocation, until the next one comes in.

So, to effectively monitor a serverless system, we have to gather as much data as possible - while it is actually handling a request.

Monitoring the Ephemeral. The Dynamic. The Inaccessible.

Serverless offers the benefit of less management, through higher levels of abstraction; for obvious reasons, that comes hand in hand with the caveat of less visibility.

In short, you pretty much have to either:

  • depend on what the serverless platform provider discloses to you, or
  • write your own monitoring utilities (telemetry agents, instrumentations etc.) to squeeze out more metrics from the runtime

Log Analysis

Logs are the most common means of monitoring, auditing and troubleshooting traditional applications; not surprisingly, it holds true in serverless as well.

What's in a Log?

All major serverless platforms offer comprehensive logging for their FaaS elements: CloudWatch Logs for AWS Lambda, StackDriver Logging for Google Cloud Functions, Azure Monitor Logs for Azure Functions, CloudMonitor for Alibaba Cloud Functions, and so forth.

The logs usually contain:

  • execution start marker, with a unique ID for each request/invocation
  • all application logs generated during execution, up until the point of completion of the invocation
  • execution summary: duration, resources used, billed quota etc.

Serverless is not just FaaS; and logging is not just about function executions. Other services like storage, data-storage and networking also provide their share of logging. While these are mostly associated with access and security auditing (e.g. CloudTrail auditing), they can still be merged with FaaS logs to enable more verbose, detailed monitoring.

Distributed Logging: A Nightmare?

One problem with the inherently distributed nature of serverless systems, is that these logs are usually scattered all over the place; unlike in a traditional monolith where all logs would be neatly arranged in one or a few well-known files.

Imagine your backend consists of five Lambdas, which the web client invokes in a particular sequence to get a job done - or are coordinated through Step Functions or Destinations; the logs for a single "call" could span five log streams in five log groups.

It may sound simple enough during development; but when your production app goes viral and starts receiving hundreds of concurrent calls, tracking a single client journey through the logs could become harder than finding a needle in a haystack.

Log Aggregation

This is where log aggregation services come into play. (In fact, serverless was lucky - because log management had already received a boost, thanks to microservice architecture.) Services like Coralogix and Dashbird will ingest your logs (via push or pull) and allow you to perform filters, aggregations, summarizations etc. as if they were from one or a few sources.

With visibility to long-term data, aggregation services can - and do - actually provide more intelligent outputs; such as real-time alerts on predefined error levels/codes, and stability- or security-oriented anomaly detection through pattern recognition, machine learning etc.

Resource Usage

Even with your application logic running like clockwork, the system could start failing if it is under-provisioned and runs out of resources; or become a budget-killer if over-provisioned.

Additionally, unusual patterns in resource usage may also indicate anomalies in your applications - such as attacks, misuse and other exploits.

What can we Measure?

  • memory usage
  • execution time or latency: given that FaaS invocations are under strict timeout constraints, time becomes a critical resource. You do not want your function to time-out before completing its job; but you also do not want it to remain hung indefinitely over a bad database connection that is going to take two minutes to time-out on its own.
  • compute power used: in many platforms, allocated compute power grows in proportion to memory, so the product of allocated memory and execution time is a good relative measure for the total compute power consumed by the request. In fact, most platforms actually bill you by GB-seconds where GB refers to memory allocation.

Resource Isolation

Serverless invocations are isolated, which means one failure cannot affect another request. Sadly, it also means that each runtime instance should be able to handle the largest possible input/request on its own, as there is virtually no resource sharing across instances; one request handler cannot "borrow" memory from another, as is the case in monolithic apps with multiple services on the same runtime/VM.

This is bad in a sense, that it denies you of the luxury to maintain shared resources (e.g. connection pools, memory-mapped file caches, etc.) to be pooled across requests. But at the same time, it means that managing and monitoring per-request resources becomes easier; each time you allocate or measure it, you are doing it for a single request.

From Logs

As mentioned before, serverless logs usually contain execution summaries stating the allocated vs. maximum memory usages, and exact vs. billed execution time.

From Runtime Itself

Your application runs as a Linux process, so it is always possible to grab resource usage data from the runtime itself - either via standard language/runtime calls (e.g. NodeJS process.memoryUsage()) or by directly introspecting OS-level semantics (e.g. /proc/self/stat). Some aspects like execution time are also provided by the serverless runtime layer - such as remaining time via context.getRemainingTimeInMillis() on Lambda.

From Serverless Platform Metrics

Most platforms keep track of resource metrics themselves. AWS CloudWatch Metrics is perhaps the best example.

While CloudWatch does not yet offer memory or compute graphs, third party tooling like SigmaDash can compute them on your behalf.

Platforms usually provide better metrics for non-FaaS systems than they do for FaaS; probably because of the same challenges they face in accurately monitoring the highly dynamic environment. But they are constantly upgrading their techniques, so we can always hope for better.

For non-compute services like storage (e.g. AWS S3), persistence (e.g. AWS DynamoDB) and API hosting (e.g. AWS API Gateway), platforms offer detailed metrics. The upside with these built-in metrics is that they offer different granularity levels, and basic filtering and summarization, out of the box. The downside, often, is that they are fairly non-real-time (generally several seconds behind on the actual request).

Also, for obvious reasons, longer analysis periods mean lesser granularity. Although you can request for higher-precision data, or report custom metrics at desired precisions, it will cost you more - and, at serverless scales, such costs can add up fairly quickly.

Invocations, Errors and Throttles

While logs and resource usages can reveal anomalies during execution, these depict more straightforward serverless monitoring metrics related to the actual end results of application invocations. In that sense, resource monitoring can be treated as oriented more towards performance, whereas error/throttle monitoring leans more towards correctness, stability and scalability.

You can usually grab these numbers from the built-in metrics of the platform itself.

Invocations-to-error Ratio

Similar to signal-to-noise ratio (SNR), this is a measure of how "efficient" or "robust" your application is; the higher it is, the more requests your application can successfully serve without running into an error.

Of course, the validity of this serverless monitoring metric depends on the actual nature and intent of your code, as well as the nature of inputs; if you receive lots of erratic or failure-prone inputs, and you are actually supposed to fail the invocation in such cases, this value would be naturally high.

Throttles

Presence of throttles could indicate one of a few things:

  • You have (perhaps mistakenly) throttled your function (or the API/interface) below its regular concurrency limit.
  • Your application is under a denial-of-service (DoS) attack.
  • Your application's scalability goes beyond what the serverless platform can occur (maybe it has gone viral); you need to re-architect it to batch-up invocations, introduce back-offs to safely deal with rejections, etc.

Note that throttling issues are not always limited to front-facing elements; if you are asynchronously triggering a function from an internal data stream (e.g. a Lambda with a Kinesis trigger) you could run into throttling, based on the dynamics of the rest of the application.

Also, throttling is not always in front of FaaS. If a third-party API that your application invokes (e.g. Amazon's own seller APIs) gets throttled, you could run into issues even without an apparent increase in the fronting traffic, events or invocation counts. Worse, it could lead to chain reactions or cascading failures - where throttling of one service can flow down the execution path to others, and eventually to the user-facing components.

Once you are on the upper ends of scalability, only a good combination of API knowledge, fail-safe measures and serverless monitoring techniques - logs, throttles and runtime latency measurements - can save you from such scenarios.

Instrumenting

So far, all serverless monitoring techniques we discussed, have been dependent on what the runtime and platform offer by default, or out-of-shelf. However, people find these inadequate for monitoring serious production applications where:

  • service health and performance are critical,
  • early detection of anomalies and threats is vital, and
  • alerts and recovery actions need to be as fine-grained and real-time as possible.

To get beyond what the platform offers, you usually need to instrument your runtime and grab additional serverless monitoring insights. This can be via:

For FaaS, this obviously comes with implications on performance - your function runtime now has to spare some cycles to gather and report the metrics; in many cases, the tools also require you to modify your application code. Often these changes are subtle enough - such as importing a library, calling a third-party method, etc.; nevertheless, it goes against the developers' and dev-ops' pipe dream of code-free monitoring.

Realizing the demand for advanced serverless monitoring and diagnostics, cloud platforms themselves have also come forth with instrumentation options:

  • AWS X-Ray ships with Lambda by default, and can be enabled via a simple configuration with no code change. Once enabled, it can report the latencies of different invocation phases: initialization, individual AWS API/SDK calls, etc. With a bit of custom code it can also capture calls to any downstream HTTP service - which can come in handy when monitoring and troubleshooting latency issues.
  • Google Cloud Functions offers StackDriver Monitoring for advanced analytics via built-in timing, invocation and memory metrics; as well as custom metrics reporting and alerting.
  • Azure Functions has its own Azure Application Insights service offering performance analytics .

However, the best work related to instrumentation have come from third-party providers, such as the ones mentioned earlier. These usually require you to subscribe to their services, configure your serverless platforms to report metrics to theirs, and provide analysis results and insights intelligence through their own dashboards.

Serverless Monitoring, up against Privacy and Security Concerns

The obvious problem with delegating serverless monitoring responsibilities to third parties, is that you need to guarantee the safety of the data you are sharing; after all, it is your customers' data.

Even if you implicitly trust the third party, you need to take precautions to minimize the damage in case the monitoring data gets leaked - for the sake of your users as well as the security and integrity of your application.

  • Anonymizing and screening your logs for sensitive content,
  • using secure channels for metrics sharing, and
  • always sticking to the principle of least privilege during gathering, sharing and analysis of data

will get you started on a robust yet safe path to efficiently monitoring your serverless application.

Monday, September 16, 2019

Sigma IDE now supports Python serverless Lambda functions!

Think Serverless, go Pythonic - all in your browser!

Python. The coolest, craziest, sexiest, nerdiest, most awesome language in the world.

(Okay, this news is several weeks stale, but still...)

If you are into this whole serverless "thing", you might have noticed us, a notorious bunch at SLAppForge, blabbering about a "serverless IDE". Yeah, we have been operating the Sigma IDE - the first of its kind - for quite some time now, getting mixed feedback from users all over the world.

Our standard feedback form had a question, "What is your preferred language to develop serverless applications?"; with options Node, Java, Go, C#, and a suggestion box. Surprisingly (or perhaps not), the suggestion box was the most popular option; and except for two, all other "alternative" options were one - Python.

User is king; Python it is!

We even had some users who wanted to cancel their brand new subscription, because Sigma did not support Python as they expected.

So, in one of our roadmap meetings, the whole Python story came out; and we decided to give it a shot.

Yep, Python it is!

Before the story, some credits are in order.

Hasangi, one of our former devs, was initially in charge of evaluating the feasibility of supporting Python in Sigma. After she left, I took over. Now, at this moment of triumph, I would like to thank you, Hasangi, for spearheading the whole Pythonic move. 👏

Chathura, another of our former wizards, had tackled the whole NodeJS code analysis part of the IDE - using Babel. Although I had had some lessons on abstract syntax trees (ASTs) in my compiler theory lectures, it was after going through his code that I really "felt" the power of an AST. So this is to you, Chathura, for giving life to the core of our IDE - and making our Python journey much, much faster! 🖖

And thank you Matt - for filbert.js!

Chathura's work was awesome; yet, it was like, say, "water inside water" (heck, what kind of analogy is that?). In other words, we were basically parsing (Node)JS code inside a ReactJS (yeah, JS) app.

So, naturally, our first question - and the million-dollar one, back then - was: can we parse Python inside our JS app? And do all our magic - rendering nice popups for API calls, autodetecting resource use, autogenerating IAM permissions, and so on?

Hasangi had already hunted down filbert.js, a derivative of acorn that could parse Python. Unfortunately, before long, she and I learned that it could not understand the standard (and most popular) format of AWS SDK API calls - namely named params:

s3.put_object(
  Bucket="foo",
  Key="bar",
  Body=our_data
)

If we were to switch to the "fluent" format instead:

boto.connect_s3() \
  .get_bucket("foo") \
  .new_key("bar") \
  .set_contents_from_string(our_data)

we would have to rewrite a whole lotta AST parsing logic; maybe a whole new AST interpreter for Python-based userland code. We didn't want that much of adventure - not yet, at least.

Doctor Watson, c'mere! (IT WORKS!!)

One fine evening, I went ahead to play around with filbert.js. Glancing at the parsing path, I noticed:

...
    } else if (!noCalls && eat(_parenL)) {
      if (scope.isUserFunction(base.name)) {
        // Unpack parameters into JavaScript-friendly parameters, further processed at runtime
        var pl = parseParamsList();
...
        node.arguments = args;
      } else node.arguments = parseExprList(_parenR, false);
...

Wait... are they deliberately skipping the named params thingy?

What if I comment out that condition check?

...
    } else if (!noCalls && eat(_parenL)) {
//    if (scope.isUserFunction(base.name)) {
        // Unpack parameters into JavaScript-friendly parameters, further processed at runtime
        var pl = parseParamsList();
...
        node.arguments = args;
//    } else node.arguments = parseExprList(_parenR, false);
...

And then... well, I just couldn't believe my eyes.

Two lines commented out, and it already started working!

That was my moment of truth. I am gonna bring Python into Sigma. No matter what.

Yep. A Moment of Truth.

I just can't give up. Not after what I just saw.

The Great Refactor

When we gave birth to Sigma, it was supposed to be more of a PoC - to prove that we can do serverless development without a local dev set-up, dashboard and documentation round-trips, and a mountain of configurations.

As a result, extensibility and customizability weren't quite in our plate back then. Things were pretty much bound to AWS and NodeJS. (And to think that we still call 'em "JavaScript" files... 😁)

So, starting from the parser, a truckload of refactoring was awaiting my eager fingers. Starting with a Language abstraction, I gradually worked my way through editor and pop-up rendering, code snippet generation, building the artifacts, deployment, and so forth.

(I had tackled a similar challenge when bringing in Google Cloud support to Sigma - so I had a bit of an idea on how to approach the whole thing.)

Test environment

Ever since Chathura - our ex-Adroit wizard - implemented it single-handedly, the test environment was a paramount one among Sigma's feature set. If Python were to make an impact, we were also gonna need a test environment for Python.

Things start getting a bit funky here; thanks to its somewhat awkward history, Python has two distint "flavours": 2.7 and 3.x. So, in effect, we need to maintain two distinct environments - one for each version - and invoke the correct one based on the current function's runtime setting.

(Well now, in fact we do have the same problem for NodeJS as well (6.x, 8.x, 10.x, ...); but apparently we haven't given it much thought, and it hasn't caused any major problems as well! 🙏)

pip install

We also needed a new contraption for handling Python (pip) dependencies. Luckily pip was already available on the Lambda container, so installation wasn't a major issue; the real problem was that they had to be extracted right into the project root directory in the test environment. (Contrary to npm, where everything goes into a nice and manageable node_modules directory - so that we can extract and clean up things in one go.) Fortunately a little bit of (hopefully stable!) code, took us through.

`pip`, and the Python Package Index

Life without __init__.py

Everything was running smoothly, until...

from subdirectory.util_file import util_func
  File "/tmp/pypy/ding.py", line 1, in <module>
    from subdirectory.util_file import util_func
ImportError: No module named subdirectory.util_file

Happened only in Python 2.7, so this one was easy to figure out - we needed an __init__.py inside subdirectory to mark it as an importable module.

Rather than relying on the user to create one, we decided to do it ourselves; whenever a Python file gets created, we now ensure that an __init__.py also exists in its parent directory; creating an empty file if one is absent.

Dammit, the logs - they are dysfunctional!

SigmaTrail is another gem of our Sigma IDE. When writing a Lambda piece by piece, it really helps to have a logs pane next to your code window. Besides, what good is a test environment, if you cannot see the logs of what you just ran?

Once again, Chathura was the mastermind behind SigmaTrail. (Well, yeah, he wrote more than half of the IDE, after all!) His code was humbly parsing CloudWatch logs and merging them with LogResults returned by Lambda invocations; so I thought I could just plug it in to the Python runtime, sit back, and enjoy the view.

I was terribly wrong.

Raise your hand, those who use logging in Python!

In Node, the only (obvious) way you're gonna get something out in the console (or stdout, technically) is via one of those console.{level}() calls.

But Python gives you options - say the builtin print, vs the logging module.

If you go with logging, you have to:

  1. import logging,
  2. create a Logger and set its handler's level - if you want to generate debug logs etc.
  3. invoke the appropriate logger.{level} or logging.{level} method, when it comes to that

Yeah, on Lambda you could also

context.log("your log message\n")

if you have your context lying around - still, you need that extra \n at the end, to get it to log stuff to its own line.

But it's way easier to just print("your log message") - heck, if you are on 2.x, you don't even need those braces!

Good for you.

But that poses a serious problem to SigmaTrail.

Yeah. We have a serious problem.

All those print lines, in one gook of text. Yuck.

For console.log in Node, Lambda automagically prepends each log with the current timestamp and request ID (context.awsRequestId). Chathura had leveraged this data to separate out the log lines and display them as a nice trail in SigmaTrail.

But now, with print, there were no prefixes. Nothing was getting picked up.

Fixing this was perhaps the hardest part of the job. I spent about a week trying to understand the code (thanks to the workers-based pattern); and then another week trying to fix it without breaking the NodeJS flow.

By now, it should be fairly stable - and capable of handling any other languages that could be thrown at it as time passes by.

The "real" runtime: messing with PYTHONPATH

After the test environment came to life, I thought all my troubles were over. The "legacy" build (CodeBuild-driven) and deployment were rather straightforward to refactor, so I was happy - and even about to raise the green flag for an initial release.

But I was making a serious mistake.

I didn't realize it, until I actually invoked a deployed Lambda via an API Gateway trigger.

{"errorMessage": "Unable to import module 'project-name/func'"}

What the...

Unable to import module 'project-name/func': No module named 'subdirectory'

Where's ma module?

The tests work fine! So why not production?

After a couple of random experiments, and inspecting Python bundles generated by other frameworks, I realized the culprit was our deployment archive (zipfile) structure.

All other bundles have the functions at top level, but ours has them inside a directory (our "project root"). This wasn't a problem for NodeJS so far; but now, no matter how I define the handler path, AWS's Python runtime fails to find it!

Changing the project structure would have been a disaster; too much risk in breaking, well, almost everything else. A safer idea would be to override one of the available settings - like a Python-specific environmental variable - to somehow get our root directory on to PYTHONPATH.

A simple hack

Yeah, the answer is right there, PYTHONPATH; but I didn't want to override a hand-down from AWS Gods, just like that.

So I began digging into the Lambda runtime (yeah, again) to find if there's something I could use:

import os

def handler(event, context):
    print(os.environ)

Gives:

{'PATH': '/var/lang/bin:/usr/local/bin:/usr/bin/:/bin:/opt/bin',
'LD_LIBRARY_PATH': '/var/lang/lib:/lib64:/usr/lib64:/var/runtime:/var/runtime/lib:/var/task:/var/task/lib:/opt/lib',
...
'LAMBDA_TASK_ROOT': '/var/task',
'LAMBDA_RUNTIME_DIR': '/var/runtime',
...
'AWS_EXECUTION_ENV': 'AWS_Lambda_python3.6', '_HANDLER': 'runner_python36.handler',
...
'PYTHONPATH': '/var/runtime',
'SIGMA_AWS_ACC_ID': 'nnnnnnnnnnnn'}

LAMBDA_RUNTIME_DIR looked like a promising alternative; but unfortunately, AWS was rejecting it. Each deployment failed with the long, mean error:

Lambda was unable to configure your environment variables because the environment variables
you have provided contains reserved keys that are currently not supported for modification.
Reserved keys used in this request: LAMBDA_RUNTIME_DIR

Nevertheless, that investigation revealed something important: PYTHONPATH in Lambda wasn't as complex or crowded as I imagined.

'PYTHONPATH': '/var/runtime'

And apparently, Lambda's internal agents don't mess around too much with it. Just pull out and read /var/runtime/awslambda/bootstrap.py and see for yourself. 😎

PYTHONPATH works. Phew.

It finally works!!!

So I ended up overriding PYTHONPATH, to include the project's root directory, /var/task/project-name (in addition to /var/runtime). If you want something else to appear there, feel free to modify the environment variable - but leave our fragment behind!

On the bright side, this should mean that my functions should work in other platforms as well - since PYTHONPATH is supposed to be cross-platform.

Google Cloud for Python - Coming soon!

With a few tune-ups, we could get Python working on Google Cloud Functions as well. It's already in our staging environment; and as soon as it goes live, you GCP fellas would be in luck! 🎉

Still a long way to go... But Python is already alive and kicking!

You can enjoy writing Python functions in our current version of the IDE. Just click the plus (+) button on the top right of the Projects pane, select New Python Function File (or New Python File), and let the magic begin!

And of course, let us - and the world - know how it goes!

Monday, November 12, 2018

Serverless Security: Putting it on Autopilot

Ack: This article is a remix of stuff learned from personal experience as well as from multiple other sources on serverless security. I cannot list down or acknowledge all of them here; nevertheless, special thanks should go to The Register, Hacker Noon, PureSec, and the Serverless Status and Serverless (Cron)icle newsletters.

We all love to imagine that our systems are secure. And then...

BREACH!!!

A very common nightmare shared by every developer, sysadmin and, ultimately, CISO.

You'd better inform the boss...

Inevitable?

One basic principle of computer security states that no system can attain absolute security. Just like people: nobody is perfect. Not unless it is fully isolated from the outside; which, by today's standards, is next to impossible - besides, what's the point of having a system that cannot take inputs and provide outputs?

Whatever advanced security precaution you take, attackers will eventually find a way around. Even if you use the most stringent encryption algorithm with the longest possible key size, attackers will eventually brute-force their way through; although it could be time-wise infeasible at present, who can guarantee that a bizaare technical leap would render it possible tomorrow, or the next day?

But it's not the brute-force that you should really be worried about: human errors are way more common, and can have devastating effects on systems security; much more so than a brute-forced passkey. Just have a peek at this story where some guys just walked into the U.S. IRS building and siphoned out millions of dollars, without using a single so-called "hacking" technique.

As long as systems are made and operated by people—who are error-prone by nature—they will never be truly secure.

Remember those old slides from college days?

So, are we doomed?

No.

Ever seen the insides of a ship?

How its hull is divided into compartments—so that one leaking compartment does not cause the whole ship to sink?

People often apply a similar concept in designing software: multiple modules so that one compromised module doesn't bring the whole system down.

A ship's watertight hull compartments

Combined with the principle of least privilege, this means that a component will compromise the least possible degree of security—ideally the attacker will only be able to wreak havoc within the bounds of the module's security scope, never beyond.

Reducing the blast radius of the component, and consequently the attack surface that it exposes for the overall system.

A security sandbox, you could say.

And a pretty good one at that.

PoLP: The Principle of Least Privilege

Never give someone - or something - more freedom than they need.

More formally,

Every module must be able to access only the information and resources that are necessary for its legitimate purpose. - Wikipedia

This way, if the module misbehaves (or is forced to misbehave, by an entity with malicious intent—a hacker, in English), the potential harm it can cause is minimized; without any preventive "action" being taken, and even before the "breach" is identified!

It never gets old

While the principle was initially brought up in the context of legacy systems, it is even more so applicable for "modern" architectures; SOA (well, maybe not so "modern"), microservices, and FaaS (serverless functions, hence serverless security) as well.

The concept is pretty simple: use the underlying access control mechanisms to restrict the permissions available for your "unit of execution"; may it be a simple HTTP server/proxy, web service backend, microservice, container, or serverless function.

Meanwhile, in the land of no servers...

With increased worldwide adoption of serverless technologies, the significance of serverless security, and the value of our PoLP, is becoming more obvious than ever.

Server-less = effort-less

Not having to provision and manage the server (environment) means that serverless devops can proceed at an insanely rapid pace. With CI/CD in place, it's just a matter of code, commit and push; everything would be up and running within minutes, if not seconds. No SSH logins, file uploads, config syncs, service restarts, routing shifts, or any of the other pesky devops chores associated with a traditional deployment.

"Let's fix the permissions later."

Alas, that's a common thing to hear among those "ops-free" devs (like myself). You're in a haste to push the latest updates to staging, and the "easy path" to avoid a plethora of "permission denied" errors is to relax the permissions on your FaaS entity (AWS Lambda, Azure Function, whatever).

Staging will soon migrate to prod. And so will your "over-permissioned" function.

And it will stay there. Far longer than you think. You will eventually shift your traffic to updated versions, leaving behind the old one untouched; in fear of breaking some other dependent component in case you step on it.

And then come the sands of time, covering the old function from everybody's memories.

An obsolete function with unpatched dependencies and possibly flawed logic, having full access to your cloud resources.

A serverless time bomb, if there ever was one.

Waiting for the perfect time... to explode

Yes, blast radius; again!

If we adhere to the least privilege principle, right from the staging deployment, it would greatly reduce the blast radius: by limiting what the function is allowed to do, we automatically limit the "extent of exploitation" upon the rest of the system if its control ever falls into the wrong hands.

Nailing serverless security: on public cloud platforms

These things are easier said than done.

At the moment, among the leaders of public-cloud FaaS technology, only AWS has a sufficiently flexible serverless security model. GCP automatically assigns a default project-level Cloud Platform service account to all its functions in a given project, meaning that all your functions will be in one basket in terms of security and access control. Azure's IAM model looks more promising, but it still lacks the cool stuff like automatic role-based runtime credential assignments available in both AWS and GCP.

AWS has applied its own IAM role-based permissions model for its Lambda functions, granting users the flexibility to define a custom IAM role—with fully customizable permissions—for every single Lambda function if so desired. It has an impressive array of predefined roles that you can extend upon, and has well-defined strategies for scoping permission to resource or principal categories, merging rules that refer to the same set of resources or operations, and so forth.

This whole hierarchy finally boils down to a set of permissions, each of which takes a rather straightforward format:

{
    "Effect": "Allow|Deny",
    "Action": "API operation matcher (pattern), or array of them",
    "Resource": "entity matcher (pattern), or array of them"
}

In English, this simply means:

Allow (or deny) an entity (user, EC2 instance, lambda; whatever) that possesses this permission, to perform the matching API operation(s) against the matching resource(s).

(There are non-mandatory fields Principal and Condition as well, but we'll skip them here for the sake of brevity.)

Okay, okay! Time for some examples.

{
    "Effect": "Allow",
    "Action": "s3:PutObject",
    "Resource": "arn:aws:s3:::my-awesome-bucket/*"
}

This allows the assignee to put an object (s3:PutObject) into the bucket named my-awesome-bucket.

{
    "Effect": "Allow",
    "Action": "s3:PutObject",
    "Resource": "arn:aws:s3:::my-awesome-*"
}

This is similar, but allows the put to be performed on any bucket whose name begins with my-awesome-.

{
    "Effect": "Allow",
    "Action": "s3:*",
    "Resource": "*"
}

This allows the assignee to do any S3 operation (get/put object, delete object, or even delete bucket) against any bucket in its owning AWS account.

And now the silver bullet:

{
    "Effect": "Allow",
    "Action": "*",
    "Resource": "*"
}

Yup, that one allows oneself to do anything on anything in the AWS account.

The silver bullet

Kind of like the AdministratorAccess managed policy.

And if your principal (say, lambda) gets compromised, the attacker effectively has admin access to your AWS account!

A serverless security nightmare. Needless to say.

To be avoided at all cost.

Period.

In that sense, the best option would be a series of permissions of the first kind; ones that are least permissive (most restricrive) and cover a narrow, well-defined scope.

How hard can that be?

The caveat is that you have to do this for every single operation within that computation unit—say lambda. Every single one.

And it gets worse when you need to configure event sources for triggering those units.

Say, for an API Gateway-triggered lambda, where the API Gateway service must be granted permission to invoke your lambda in the scope of a specific APIG endpoint (in CloudFormation syntax):

{
  "Type": "AWS::Lambda::Permission",
  "Properties": {
    "Action": "lambda:InvokeFunction",
    "FunctionName": {
      "Ref": "LambdaFunction"
    },
    "SourceArn": {
      "Fn::Sub": [
        "arn:aws:execute-api:${AWS::Region}:${AWS::AccountId}:${__ApiId__}/*/${__Method__}${__Path__}",
        {
          "__Method__": "POST",
          "__Path__": "/API/resource/path",
          "__ApiId__": {
            "Ref": "RestApi"
          }
        }
      ]
    },
    "Principal": "apigateway.amazonaws.com"
  }
}

Or for a Kinesis stream-powered lambda, in which case things get more complicated: the Lambda function requires access to watch and pull from the stream, while the Kinesis service also needs permission to trigger the lambda:

  "LambdaFunctionExecutionRole": {
    "Type": "AWS::IAM::Role",
    "Properties": {
      "ManagedPolicyArns": [
        "arn:aws:iam::aws:policy/service-role/AWSLambdaBasicExecutionRole"
      ],
      "AssumeRolePolicyDocument": {
        "Version": "2012-10-17",
        "Statement": [
          {
            "Action": [
              "sts:AssumeRole"
            ],
            "Effect": "Allow",
            "Principal": {
              "Service": [
                "lambda.amazonaws.com"
              ]
            }
          }
        ]
      },
      "Policies": [
        {
          "PolicyName": "LambdaPolicy",
          "PolicyDocument": {
            "Statement": [
              {
                "Effect": "Allow",
                "Action": [
                  "kinesis:GetRecords",
                  "kinesis:GetShardIterator",
                  "kinesis:DescribeStream",
                  "kinesis:ListStreams"
                ],
                "Resource": {
                  "Fn::GetAtt": [
                    "KinesisStream",
                    "Arn"
                  ]
                }
              }
            ]
          }
        }
      ]
    }
  },
  "LambdaFunctionKinesisTrigger": {
    "Type": "AWS::Lambda::EventSourceMapping",
    "Properties": {
      "BatchSize": 100,
      "EventSourceArn": {
        "Fn::GetAtt": [
          "KinesisStream",
          "Arn"
        ]
      },
      "StartingPosition": "TRIM_HORIZON",
      "FunctionName": {
        "Ref": "LambdaFunction"
      }
    }
  },
  "KinesisStreamPermission": {
    "Type": "AWS::Lambda::Permission",
    "Properties": {
      "Action": "lambda:InvokeFunction",
      "FunctionName": {
        "Ref": "LambdaFunction"
      },
      "SourceArn": {
        "Fn::GetAtt": [
          "KinesisStream",
          "Arn"
        ]
      },
      "Principal": "kinesis.amazonaws.com"
    }
  }

So you see, with this granularity, comes great power as well as great responsibility. One missing permission—heck, one mistyped letter—and it's 403 AccessDeniedException.

No easy way; you just have to track down every AWS resource triggering or accessed by your function, look up the docs, pull out your hair, and come up with the necessary permissions.

But... but... that's too much work!

Yup, it is. If you're doing it manually.

But who drives manual these days? :)

Fortunately there are quite a few options, if you're already into automating stuff:

serverless-puresec-cli: thanks PureSec!

If you're using the famous Serverless Framework - which means you're already covered on the trigger permissions front - there's the serverless-puresec-cli plugin from Puresec.

Puresec

The plugin can statically analyze your lambda code and generate a least-privilege role. Looks really cool, but the caveat is that you have to run the serverless puresec gen-roles command before every deployment with code changes; I couldn't yet find a way to run it automatically - during serverless deploy, for example. Worse, it just prints the generated roles into stdout; so you have to manually copy-paste it into serverless.yml, or use some other voodoo to actually inject it into the deployment configuration (hopefully things would improve in the future :))

AWS Chalice: from the Gods

If you're a Python fan, Chalice is capable of auto-generating permissions for you, natively. Chalice is awesome in many aspects; super-fast deployments, annotation-driven triggers, little or no configurations to take care of, and so forth.

AWS Chalice

However, despite being a direct hand-down from the AWS gods, it seems to have missed the word "minimal" when it comes to permissions; if you have the code to list the contents of some bucket foo, it will generate permissions for listing content of all buckets in the AWS account ("Resource": "*" instead of "Resource": "arn:aws:s3:::foo/*"), not just the bucket you are interested in. Not cool!

No CLI? go for SLAppForge Sigma

If you're a beginner, or not that fond of CLI tooling, there's Sigma from SLAppForge.

SLAppForge Sigma

Being a fully-fledged browser IDE, Sigma will automatically analyze your code as you compose (type or drag-n-drop) it, and derive the necessary permissions—for the Lambda runtime as well as for the triggers—so you are fully covered. The recently introduced Permission Manager also allows you to modify these auto-generated permissions if you desire; for example, if you are integrating a new AWS service/operation that Sigma doesn't yet know about.

Plus, with Sigma, you never have to worry about any other configurations; resource configs, trigger mappings, entity interrelations and so forth—the IDE takes care of it all.

The caveat is that Sigma only supports NodeJS at the moment; but Python, Java and other cool languages are on their way!

(Feel free to comment below, if you have other cool serverless security policy generation tools in mind! And no, AWS Policy Generator doesn't count.)

In closing

Least privilege principle is crucial for serverless security, and software design in general; sooner or later, it will save your day.

Lambda's highly granular IAM permission model is ideal for the PoLP.

Tools like the Puresec CLI plugin, all-in-one Sigma IDE and AWS Chalice can automate security policy generation; making your life easier, and still keeping the PoLP promise.

Monday, July 16, 2018

Google, Here We Come!

Google is catching up fast on the serverless race.

And we are, too.

That's how our serverless IDE Sigma recently started supporting integrations with Google Cloud Platform, pet-named GCP.

What the heck does that mean?

To be extra honest, there's nothing new so far. Sigma had had the capability to interact with GCP (and any other cloud service, for that matter) right from the beginning; we just didn't have the scaffolding to make things easy and fun—the nice drag-n-drops and UI pop-ups, and the boilerplate code for handling credentials.

Now, with the bits 'n' pieces in place, you can drag, drop and operate on your GCP stuff right inside your Sigma project!

(*) Conditions apply

Of course, there are some important points (well, let's face it, limitations):

  • GCP access is confined to one project, meaning that all cloud resources accessed in a Sigma project should come from a single GCP project. You can of course work around this by writing custom authorization logic on your own, but drag-n-drop stuff will still work only for the first project you configured.
  • You can only interact with existing resources, and only as operations (no trigger support). New resource creation and trigger configurations require deeper integration with GCP, which will become available soon (fingers crossed).
  • Only a handful of resource types are currently supported—including Storage, Pub/Sub, Datastore and SQL. These should, however, cover most of the common scenarios; we are hoping to give more attention to big data and machine learning stuff in the immediate future—which Google also seems to be thriving upon—but feel free to shout out so we can reconsider our strategy!

So, where can I get this thing?

'GCP Resources' button on the Resources pane

  • Now you can provide a service account key from the desired GCP project in order to access its resources via Sigma. Click Authorize, paste the JSON service account key, and press Save.

GCP Resources pane with 'Authorize' button

GCP Service Account Key pop-up

  • The Resources pane will now display the available GCP resource types. You can drag-n-drop them into your code, configure new operations and edit existing ones, just like you would do with AWS resources.

Resources pane displaying available GCP resource types

(Disclaimer: The list you see may be different, depending on how old this post is.)

But you said there's nothing new!

How could I have done this earlier?

Well, if you look closely, you'll see what we do behind the scenes:

  • We have two environment variables, GCP_SERVICE_TOKEN and GCP_PROJECT_ID, which expose the GCP project identity and access to your Sigma app.
  • Sigma has an Authorizer file that reads this content and configures the googleapis NodeJS client library, using them as credentials.
  • Your code imports Authorizer (which runs the abovementioned configuration stuff), and invokes operations via googleapis, effectively operating on the resources in your GCP project.

See? No voodoo.

Of course, back in those days, you won't have seen the nice UI pop-ups, or the drag 'n' drop capability; so we've had to do a bit of work, after all.

Not cool! I want more!!

Relax, the really cool stuff is already on the way:

  • Ability to define new GCP resources, right within the IDE (drag-drop-configure, of course!)
  • Ability to use GCP resources as triggers (say, fire a cloud function via a Cloud Storage bucket or a Pub/Sub topic)

And, saving the best for the last,

  • Complete application deployments on Google Cloud Platform!

And...

  • A complete cross-cloud experience: operating on AWS from within GCP, and vice versa!
  • With other players (MS Azure, Alibaba Cloud and so forth) joining the game, pretty soon!

So, stay tuned!

Friday, April 20, 2018

Serverless: a no-brainer!

Few years ago, containers swept through the dev and devops lands like a category-6 hurricane.

Docker. Rkt. others.

Docker Swarm.

K8s.

OpenShift.

Right now we are literally at the epicenter, but when we glimpse at the horizon we see another one coming!

Serverless.

The funny thing is, "serverless" itself is a misnomer.

Of course there are servers. There are always servers. How can programs execute themselves in thin air, without the support of the underlying hardware and utility modules? So, there are servers.

Just not where you would expect them to be.

Traversing the timeline of computing, we see the turbulent track record?? of servers: birth in secret dungeons of vaccum tubes and city-scale power supplies; multi-ton boxes; networks; clusters; cloud datacenters and server farms (agriculture just lost its royalty!); containers.

Over time, we see servers losing their significance. Gradually, but steadily.

And now, suddenly, puff! They are gone.

Invisible, to be precise.

With serverless, you no longer care about the server. It may be a physical machine, a cloud VM, a K8s pod, an ECS container... heck, even an IoT rig.

Nobody cares, as long as the job gets done.

In this sense, we realize that serverless is nothing new; the concept, and even some pracical implementations, have been there since as far back as 2006. You yourself may have benefited from serverless (or conceptually serverless) architectures; while one may argue them to be PaaSes, Google App Engine and Google Apps Script (especially) are good examples from my Google-ridden "fungramming" history.

Just like touchscreens, serverless resemblances had always been there, but never has the marketing hype been this intense - obviously it is growing, and we'll surely see more of it as time flies by.

AWS had an early entry to the arena and currently owns a huge market share, bigger than all the others combined; Azure is behind, but catching up fast; and Google still seems to be more focused on Kubernetes and related containerization stuff although they too are on the track with Cloud Functions and Firebase.

Streaming and event-driven architectures are playing their part in bringing value to serverless. We should also not forget the cloud hype that made people go every-friggin-thing-as-a-service and later left them wondering how they could pay only for what they really use, only while they use it.

All ramblings aside, serverless is growing in popularity. Platforms are evolving to support more event sources, better integration support for other services and richer monitoring and statistics. Frameworks like Serverless are striving to provide a unified and generifier serverless development experience while IDEs like Sigma are doing their part in helping newbies (and sometimes even professionals) get going with serverless with minimum hassle and maximum speed.

Being new and shiny does not necessarily mean that serverless is the silver bullet for all your dev issues; in fact, right now it fits into only a few enterprise use cases (primarily due to the lack of strong guarantees, which are quite commonplace in the bureaucratic enterprise atmosphere). Nevertheless, providers are already working on this, and we can expect some disruptive - if not revolutionary - changes in the not-too-distant future. However it is always best to re-iterate your requirements before officially stepping into the serverless world, because serverless demands quite a shift in your application architecture, devops, as well as the very core of your developer mindset.

And, of course, the best way to pick the cake is to taste it yourself.

Sigma the Serverless IDE: resources, triggers, and heck, operations

With serverless, you stopped caring about the server.

With Sigma, you stopped (or will stop, if not already) about the platform.

Now all you care about is your code - the bliss of every programmer.

Or is it?

I hold her (the code) in my arms.

If you have done time with serverless frameworks, you would already know how they take away your platform-phobia, abstracting out the platform-specific bits of your serverless app.

And if you have already tried out Sigma, you would have noticed how it takes things further, relieving you of the burden of the configuration and deployment aspects as well.

Sigma for a healthier dev life!

Leaving behind just the code.

Just the beautiful, raw code.

So, what's the catch?

Okay. Now for the untold, unspoken, not-so-popular part.

You see, my friend, every good thing comes at a price.

Lucky for you, with Sigma, the price is very affordable.

Just a matter of sticking to a few ground rules while you develop your app. That's all.

Resources, resources.

All of Sigma's voodoo depends on one key thing: resources.

Resources, resources!

The concept is quite simple: every piece of your serverless app - may it be a DynamoDB table, S3 bucket or SNS topic - is a resource from Sigma's point of view.

If you remember the Sigma UI, the Resources pane on the left contains different resource types that you can have in your serverless app. (True, it's pretty short; but we're working on it :))

Resources pane in Sigma UI

Behind the scenes

When you drag a resource from this pane, into your code, Sigma secretly creates a resource (which it would later deploy into your serverless provider) to track the configurations of the actual service entity (say, the S3 bucket that should exist in AWS by the time your function is running) and all its usages within your code. The tracking is fully automated; frankly, you didn't even want to know about that.

Sigma tracks resources in your app, and deploys them into the underlying platform!

"New" or "existing"?

On almost all of Sigma's resource configuration pop-ups, you may have noticed two options: "new" vs "existing". "New" resources are the ones that would be (or have already been) created as a result of your project, whereas "existing" ones are those which have been created outside of your project.

Now that's a tad bit strange because we would usually use "existing" to denote things that "exist", regardless of their origin - even if they came from Mars.

Better brace yourself, because this also gives rise to a weirder notion: once you have deployed your project, the created resources (which now "exist" in your account) are still treated by Sigma as "new" resources!

And, as if that wasn't enough, this makes the resources lists in Sigma behave in totally unexpected ways; after you define a "new" resource, whenever you want to reuse that resource somewhere else, you would have to look for it under the "existing" tab of the resource pop-up; but it will be marked with a " (new)" prefix because, although it is already defined, it remains "new" from Sigma's point of view.

Now, how sick is that?!

Bang head here.

Perhaps we should have called them "Sigma" resources; or perhaps even better, "project" resources; while we scratch our heads, feel free to chip in and help us with a better name!

Rule o' thumb

Until this awkwardness is settled, the easiest way to get through this mess is to stick to this rule of thumb:


If you added a resource to your current Sigma project, Sigma would treat it as a "new" resource till the end of eternity.


Bottom line: no worries!

Being able to use existing resources is sometimes cool, but it means that your project would be much less portable. Sigma will always assume that the resources referenced by your project are already in existence, regardless of whatever AWS account you attempt to deploy it. At least until (if) we (ever) come up with a different resource management mechanism.


If you want portability, always stick to new resources. That way, even if a complete stranger gets hold of your project and deploys it in his own, alien, unheard-of AWS account, the project would still work.

If you are integrating with an already existing set of resources (e.g. the set of S3 bucket in your already-running dev/test/prod environment), using existing resources is the obvious (and the most convenient) choice.


Anyways, back to our discussion:

Where were we?

Ah, yes. Resources.

The secret life of resources

In a serverless app, you basically use resources for two things:

  • for triggering the app (as an event source, a.k.a. trigger)
  • for performing work inside the app, such as invoking external services

triggers and operations

Resources? Triggers?? Operations???

Sigma also associates its resources with your serverless app in a similar fashion:

In Sigma, a function can have several triggers (as long as the application itself is aware of tackling different trigger event types!), and can contain several operations (obviously).

Yet, they're different.

It is noteworthy that a resource itself is not a trigger or an operation; triggers and operations are associated with resources (they kind of "bridge" functions and resources) but a resource has its own independent life. As a result, a resource can power many triggers (to be precise, zero or more) and get involved in many operations, across many (again, zero or more) functions.

A good example is S3. If you want to write an image resizer function that would pick and process images dropped into a S3 bucket, you would configure a S3 trigger to invoke the function upon the file drop, and a S3 GetObject operation to retrieve and process the file; however, both will point to the same S3 resource, namely the bucket where images are being dropped into and fetched from.

Launch time!

At deployment, Sigma will take care of putting the pieces together - trigger configs, runtime permissions and whatnot - based on which function is associated with which resources, and in which ways (trigger-mode vs operation-mode). You can simply drag, drop and configure your buckets, queues and stuff, write your code, and totally forget about the rest!

That's the beauty of Sigma.

When a resource is "abandoned" (meaning that it is not used in any trigger or operation), it shows up in the "unused resources" list (remember the dustbin button on the toolbar?) and can be removed from the project; remember that if you do this, provided that the resource is a "new" one (rule of thumb: one created in Sigma), it will be automatically removed from your serverless provider account (for example, AWS) during your next deployment!

So there!

if Sigma's resource model (the whole purpose of this article) looks like a total mess-up to you, feel free to raise your voice on StackOverflow - or better still, our GitHub space, FB page or Twitter feed; we would appreciate it very much!

Of course, Sigma has nothing to hide; if you check your AWS account after a few Sigma deployments, you would realize the things we have been doing under the hood.

All of it, to make your serverless journey as smooth as possible.

And easy.

And fun. :)

Welcome to the world of Sigma!